Instant Connection for Pixel Streaming
— New Feature Automated Setup
Preventing VDI & VM Downtime: Real-World Strategies That Actually Work
Preventing VDI & VM Downtime: Real-World Strategies That Actually Work
Teams & IT
Preventing VDI & VM Downtime: Real-World Strategies That Actually Work
Table of Contents
A few years ago, I watched 30% of our users get locked out of their desktops for nearly an hour, all because one storage controller in a VMware vSAN cluster hit a firmware bug during replication.
No catastrophic power failure. No ransomware attack. Just a single array hiccup that cascaded through the Horizon Connection Server pool, froze the broker queue, and left users staring at gray login screens.
By the time we restored service, the helpdesk queue looked like a DoS attack. Designers couldn’t open Adobe apps, analysts lost R sessions mid-calculation, and our QA team on Citrix couldn’t access a single VM. The infrastructure team fixed it within 45 minutes. But it took weeks to rebuild confidence.
That’s the real cost of downtime.
In a VDI or VM environment, even “minor” interruptions ripple fast. They don’t just frustrate end users, they break the illusion that your virtual workspace is as stable as a physical one. Whether you’re running Citrix Virtual Apps, Horizon, or Azure Virtual Desktop, uptime isn’t a checkbox. It’s a discipline.
And preventing downtime isn’t about buying more hardware or paying for “99.999%” SLAs. It’s about designing your environment to expect failure, and recover from it before users even notice.
In this post, I’ll walk you through the key strategies that have actually worked across real deployments, from storage redundancy and session brokering, to image drift control and predictive monitoring. These are the lessons that keep environments stable, users productive, and admins sane.
Why Downtime Happens
Every admin learns this the hard way: virtual environments don’t just “go down” out of nowhere. There’s always a chain reaction, usually triggered by something small that snowballs.
Sometimes it’s predictable. Sometimes it’s embarrassing. Usually, it’s both.
#1. Single Points of Failure
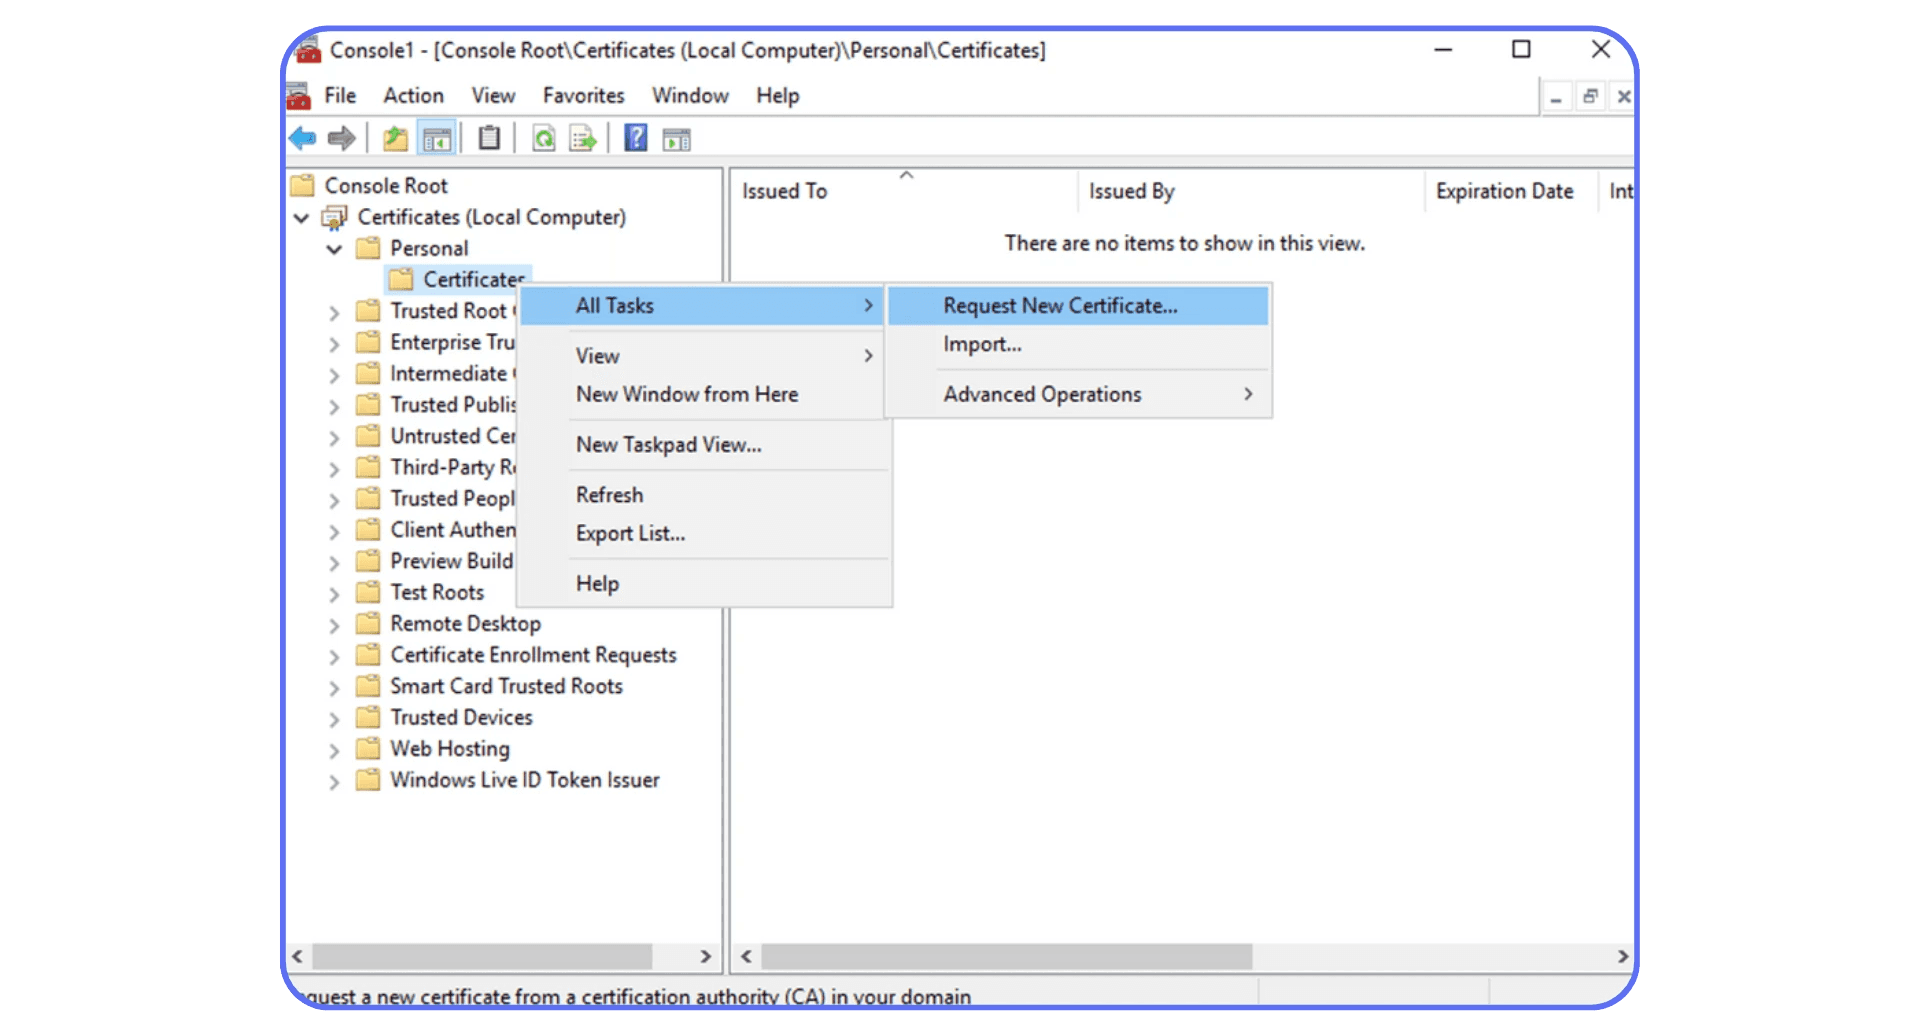
You can have redundant hosts, but if your broker, profile server, or storage path isn’t replicated, you’re one reboot away from a full outage. I’ve seen entire Horizon pods stall because a single Connection Server certificate expired. That’s not a hardware failure. That’s planning failure.
#2. Resource Contention & Mis-sizing
It’s easy to underestimate peak loads. Monday mornings, large updates, or even AI-powered tools suddenly added to user profiles, all can push CPU, RAM, or IOPS beyond thresholds. When you hear “the VM is slow” right before it dies, it’s usually resource contention.
#3. Image & Patch Drift
Your “golden image” worked perfectly on day one. But six months and thirty silent updates later, half your machines start misbehaving. Patch drift and inconsistent images create instability that’s almost invisible until login storms hit.
#4. Network & Latency Bottlenecks
Bandwidth is rarely the problem, latency and jitter are. A few milliseconds of delay on session brokers or display protocol traffic (Blast, ICA, RDP) can lock up entire sessions. Then users assume “the server’s down.”
#5. Misconfiguration & Human Error
We love automation until it deploys the wrong GPO to production. I’ve seen admins update a single registry setting across a pooled image and accidentally disable logon for hundreds of VMs. Humans remain the most efficient cause of downtime.
#6. Security Incidents & Patching Gaps
Ironically, patching to prevent breaches can also cause downtime, especially when agents, antivirus hooks, or credential providers conflict with the VDI agent. But the reverse is worse: unpatched brokers are an open door for ransomware.
#7. External Dependencies
DNS failures, authentication servers, profile disks, license managers, all external, all critical. Lose one, and your “virtual infrastructure” becomes a museum exhibit.
The bottom line?
Downtime is rarely a single failure. It’s usually a perfect storm of overlooked dependencies, human shortcuts, and assumptions that “this part never fails.”
Strategy 1: Architect for High Availability & Redundancy
If there’s one thing that separates stable environments from fragile ones, it’s how they handle failure, not whether they avoid it. Hardware dies, services crash, sessions freeze. High availability (HA) isn’t about eliminating risk. It’s about making sure users never feel it.
Eliminate Single Points of Failure
Start here.
Redundant brokers, redundant gateways, redundant storage paths. Anything less is gambling.
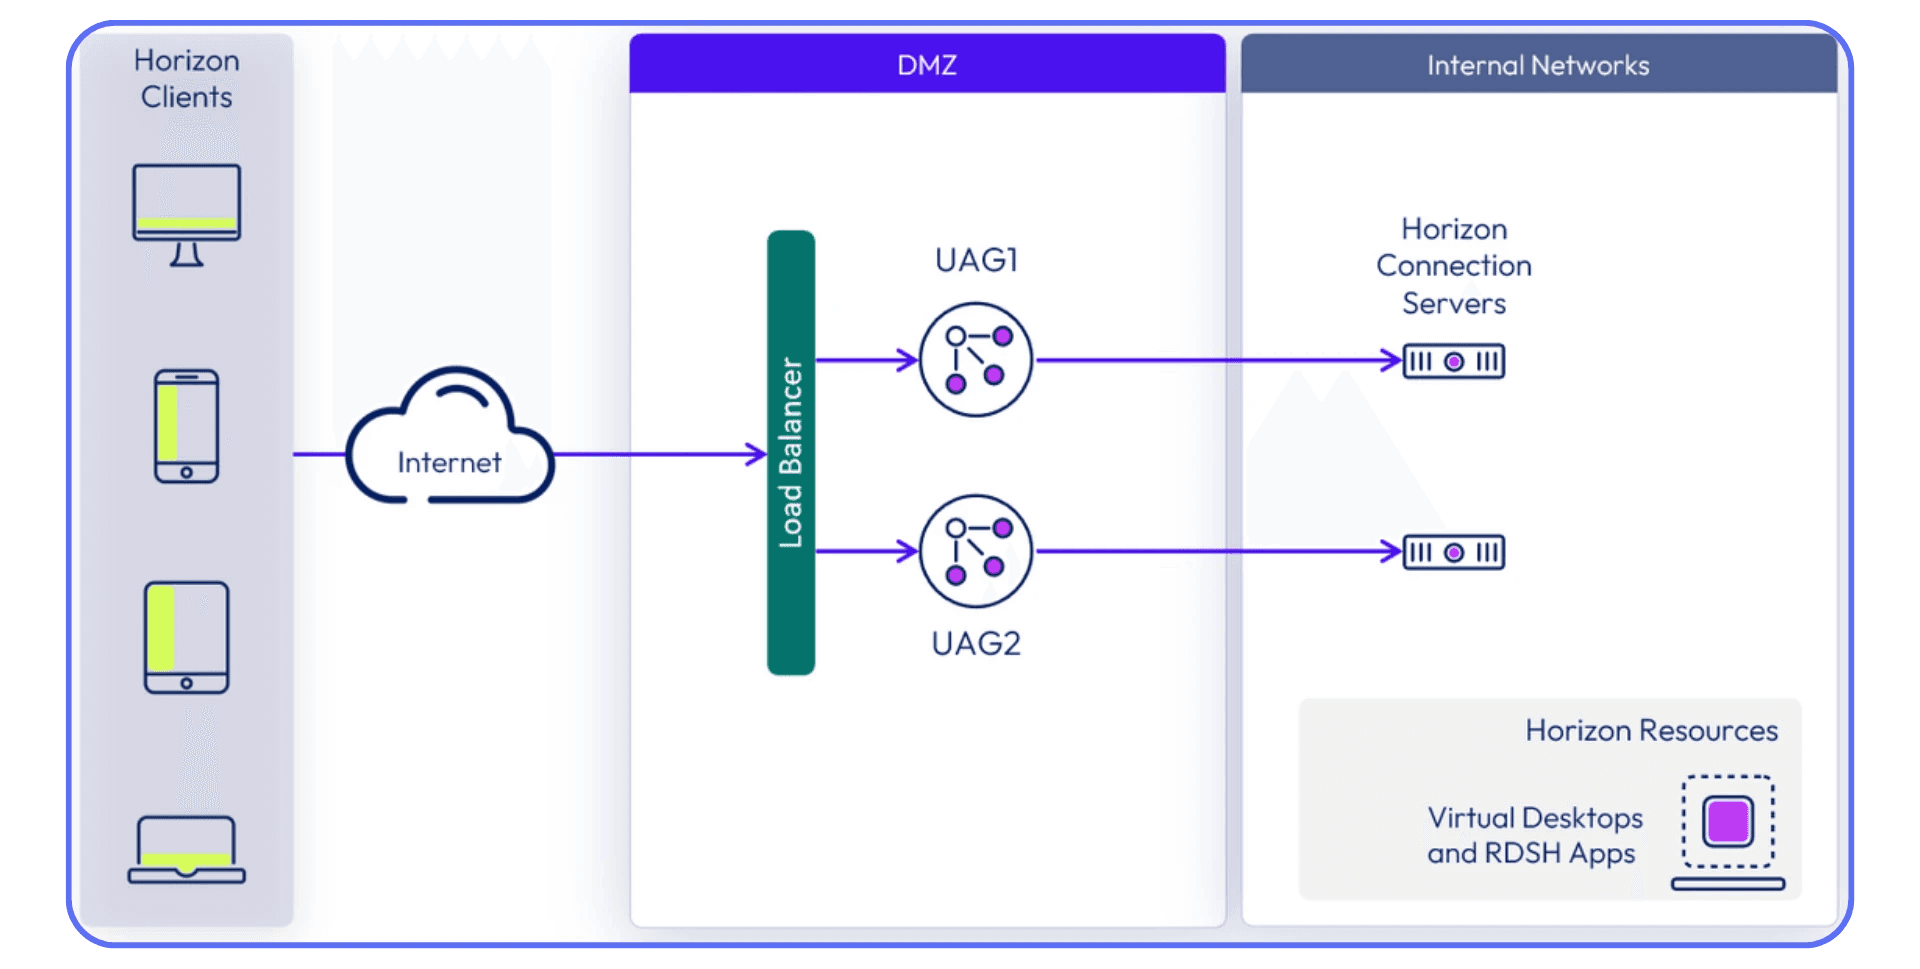
In Citrix, that means multiple Delivery Controllers. In Horizon, it’s Connection Server replicas and multiple Unified Access Gateways. For AVD, it’s ensuring load-balanced session hosts and multiple Azure regions when possible.
Your goal: no single host, NIC, or service should decide your uptime.
A misconfigured DNS record or broken certificate chain shouldn’t take down your entire desktop pool. Spread your dependencies. Even small teams can use two lightweight brokers on separate VMs, it’s cheap insurance.
Separate the Layers
Your VDI stack has distinct tiers:
Control Plane (Brokers, Licensing, DBs) → Compute Plane (Hypervisors, VMs) → Storage & Profile Services → Networking & Access.
If you mix them or collapse roles “for simplicity,” a failure in one tier can cascade through everything.
Keep them logically and physically isolated where possible. If your broker and profile share the same datastore, you’ve already lost redundancy.
Load Balancing Isn’t Optional
Redundancy without load balancing is like having a spare tire you never install.
Use proven solutions:
Citrix ADC / NetScaler or F5 BIG-IP for broker and gateway load balancing
VMware NSX or HAProxy for Horizon connection servers
Azure Front Door / Load Balancer for AVD session hosts
Distribute traffic intelligently, not round-robin blindly. Weighted and health-aware load balancing saves you from uneven load spikes and the dreaded “half the users can’t log in” scenario.
Active-Active vs. Active-Passive
Active-Passive failover is cheaper, but recovery isn’t instant. You’re relying on monitoring to trigger switchover.
Active-Active, on the other hand, gives real resilience, both sites or clusters serving users simultaneously. It’s how large-scale Horizon or Citrix environments reach near-zero RTOs (Recovery Time Objectives).
If you can’t afford a full secondary site, at least design your storage and brokers for cluster-level failover. VMware vSAN, Hyper-V clustering, or Nutanix AHV make this attainable even for mid-sized setups.
Test the Failures You Think You’ve Covered
Every team says they have redundancy. Few actually test it.
Pull the plug on a broker. Disable a datastore. Watch what happens.
If your users feel even a brief pause, your HA plan isn’t ready.
Document your expected RTO (how long to recover) and RPO (how much data loss is tolerable), then measure real numbers. You’ll probably be surprised.
Keep It Practical
Redundancy can easily become overengineering. I’ve seen teams build “bulletproof” clusters that are impossible to maintain. The goal isn’t perfection, it’s resilience. A system that fails gracefully beats one that never fails until it catastrophically does.
The takeaway: You can’t prevent every fault. But you can design your environment so a fault never becomes downtime.
Strategy 2: Proactive Monitoring, Observability & Predictive Analytics
Most environments don’t fail suddenly. They fail gradually, CPU creeping up for days, latency spikes ignored, logins taking a few seconds longer every week. Then one morning, it all collapses and someone says, “It happened out of nowhere.”
Except it didn’t. You just weren’t looking in the right place.
Beyond “Is It Up?”
Traditional monitoring asks one question: Is the server alive?
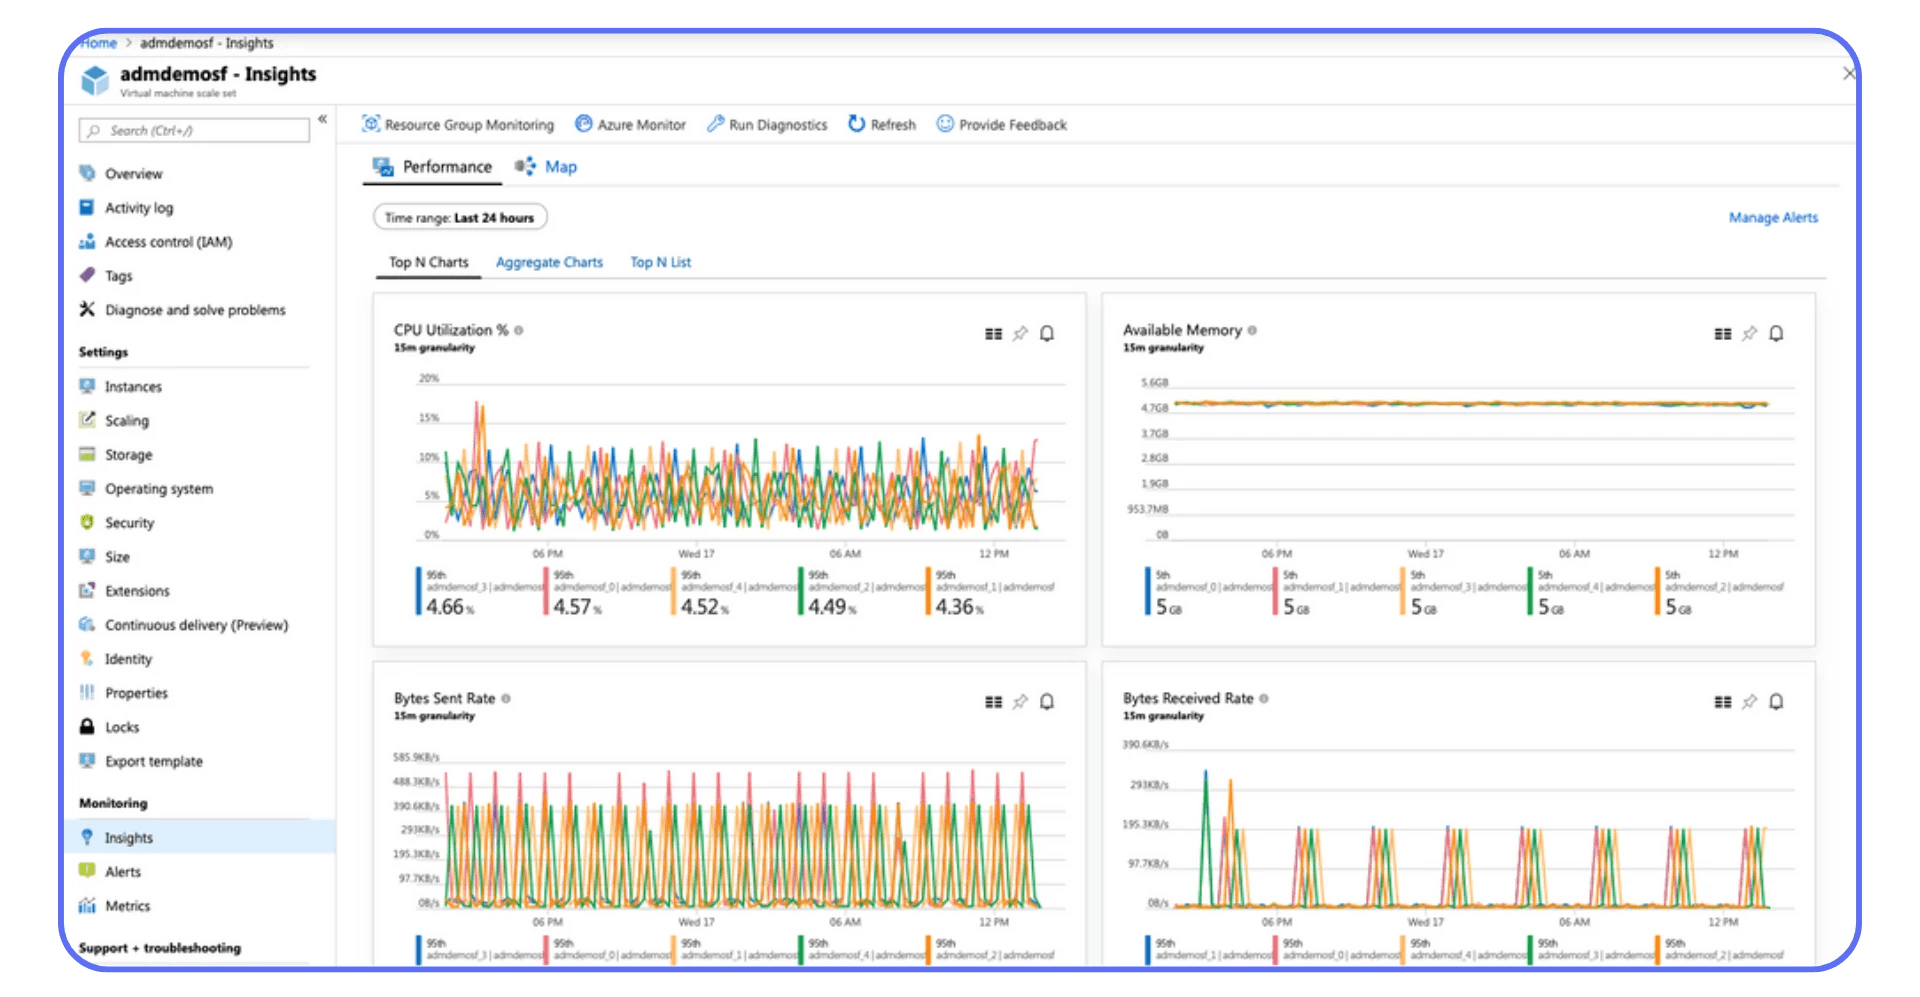
Modern observability asks: How healthy is the experience?
There’s a difference between a VM being “online” and a user being productive.
You can ping a broker all day and get green checks, while your login process takes 90 seconds because the profile disk is choking on IOPS. That’s why VDI monitoring needs to include end-user experience metrics, not just infrastructure uptime.
Build Layered Visibility
Think in tiers:
Hardware/Hypervisor Metrics: CPU, RAM, disk IOPS, NIC saturation.
VM Metrics: Guest OS performance, agent health, session count.
User Session Metrics: Logon time, protocol latency, dropped frames, reconnects.
Application Metrics: Launch times, error frequency, crash ratios.
If you only monitor one layer, you’ll always chase the wrong issue. I once saw a Citrix farm blamed for “slow sessions” when the real culprit was a misconfigured profile share on a DFS namespace. Without layered telemetry, that kind of root cause takes days to find.
Tools That Actually Help
You don’t need a dozen dashboards, you need correlation.
Here’s what works in practice:
ControlUp and Lakeside SysTrack — deep session-level visibility for Citrix & Horizon.
VMware Aria Operations for Horizon — integrates vCenter + Horizon analytics in one pane.
Azure Monitor & Log Analytics — for AVD session host performance, connection diagnostics, and FSLogix profiles.
Prometheus + Grafana — open-source stack for custom metrics pipelines (especially for hybrid or Nutanix-based environments).
Whatever stack you use, centralize logs. Fragmented data is useless during an incident.
Catch Issues Before They Escalate
Modern monitoring tools now include predictive analytics, ML-based trend detection that spots anomalies before they become downtime.
Things like:
CPU saturation trending over X% for Y hours
Storage latency rising faster than throughput
Logon time deviation from baseline > 20%
VM snapshot accumulation leading to datastore exhaustion
You don’t need AI buzzwords to do this, just good baselines and alert thresholds that evolve. A “smart” alert is one that triggers once and matters.
Automate Response Loops
Detection without reaction is noise. Tie your monitoring to actions.
If a Horizon pod exceeds CPU thresholds, trigger a PowerCLI script to start another ESXi host. If Citrix latency hits 200ms, auto-drain one Delivery Controller.
Automation turns observability into resilience.
Make It Part of Culture
Monitoring isn’t a one-time setup; it’s a feedback loop. Teams should review weekly trends, user satisfaction data, and anomaly logs. The goal isn’t just to prevent downtime, it’s to predict it, measure it, and understand it.
When your monitoring matures from “uptime” to “experience,” you stop firefighting and start forecasting. That’s where downtime prevention actually begins.
Strategy 3: Image & Patch Management Discipline
If you’ve ever spent an entire afternoon chasing random logon errors, only to realize half your VMs were running different builds of the same image, congratulations, you’ve met image drift. It’s silent, sneaky, and one of the most common causes of downtime in virtual environments.
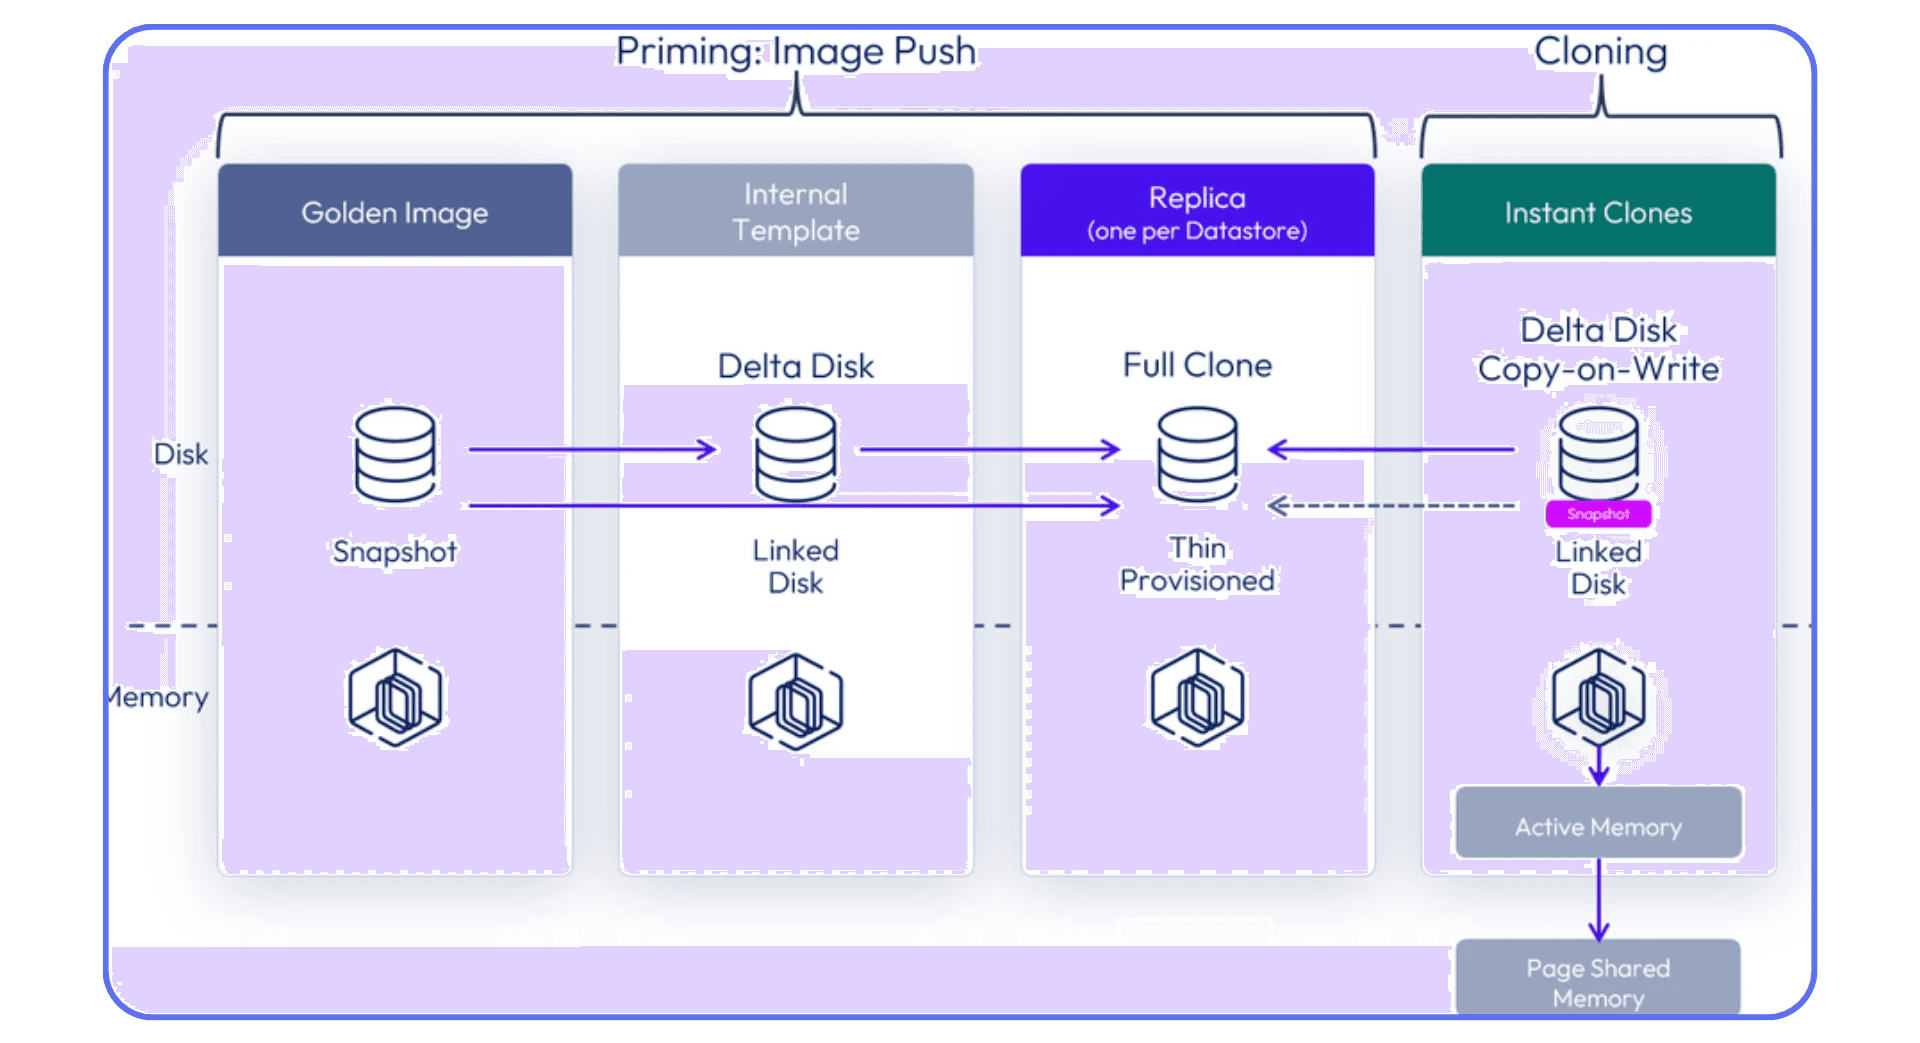
Keep One Golden Image — and Guard It Like a Vault
Everything starts with a clean, controlled “golden image.”
That’s your blueprint. Every VM, every session host, every desktop should originate from that single, hardened, optimized base.
For VMware Horizon, that’s your Instant Clone parent image.
For Citrix, your Master Image or MCS snapshot.
For AVD, your Shared Image Gallery version.
The problem? People start making “minor tweaks”, an agent update here, a driver change there. Over a few months, your “standard build” turns into five untraceable variants. Then one day, logins hang or the display driver crashes, and you have no idea which version broke it.
Lock it down. Use version control. Keep a changelog.
Patch Like a Scientist, Not Like a Hero
There’s a difference between being fast and being reckless.
Patching directly in production because Microsoft released “critical updates” last night isn’t maintenance — it’s gambling.
The disciplined approach looks like this:
Test Environment: Maintain a small clone of your production pool for patch validation.
Automate Patching Windows: Use tools like Ivanti, SCCM, or Azure Update Management to stage rollouts.
Snapshot Before Deployment: Always keep a rollback point, especially for GPU or driver-level updates.
Staggered Release: Apply patches to a limited host group first, observe for anomalies, then scale.
This approach might sound slow, but it’s far cheaper than rolling back hundreds of broken VMs at 2 a.m.
Strip the Bloat — Optimize for Performance
A smaller image means fewer moving parts to break. Remove unnecessary apps, services, scheduled tasks, and telemetry that slow down startup or conflict with your VDI agent.
Microsoft even provides an official VDI Optimization Script that trims Windows 10/11 for non-persistent environments.
In Horizon, disabling non-critical services can cut logon time by 15–25%.
In AVD, reducing background updates improves FSLogix container mounting reliability.
In Citrix, it helps avoid profile bloat and excessive I/O on logon.
Keep Versions, Not “Mystery Images”
Label and archive every version of your image with:
Build date
OS + agent version
Installed app set
Known issues or dependencies
When something breaks, you should be able to say, “Roll back to v2025.09.03,” not “Revert to that old VM we think worked fine last month.”
Automate Where Possible — But Validate Always
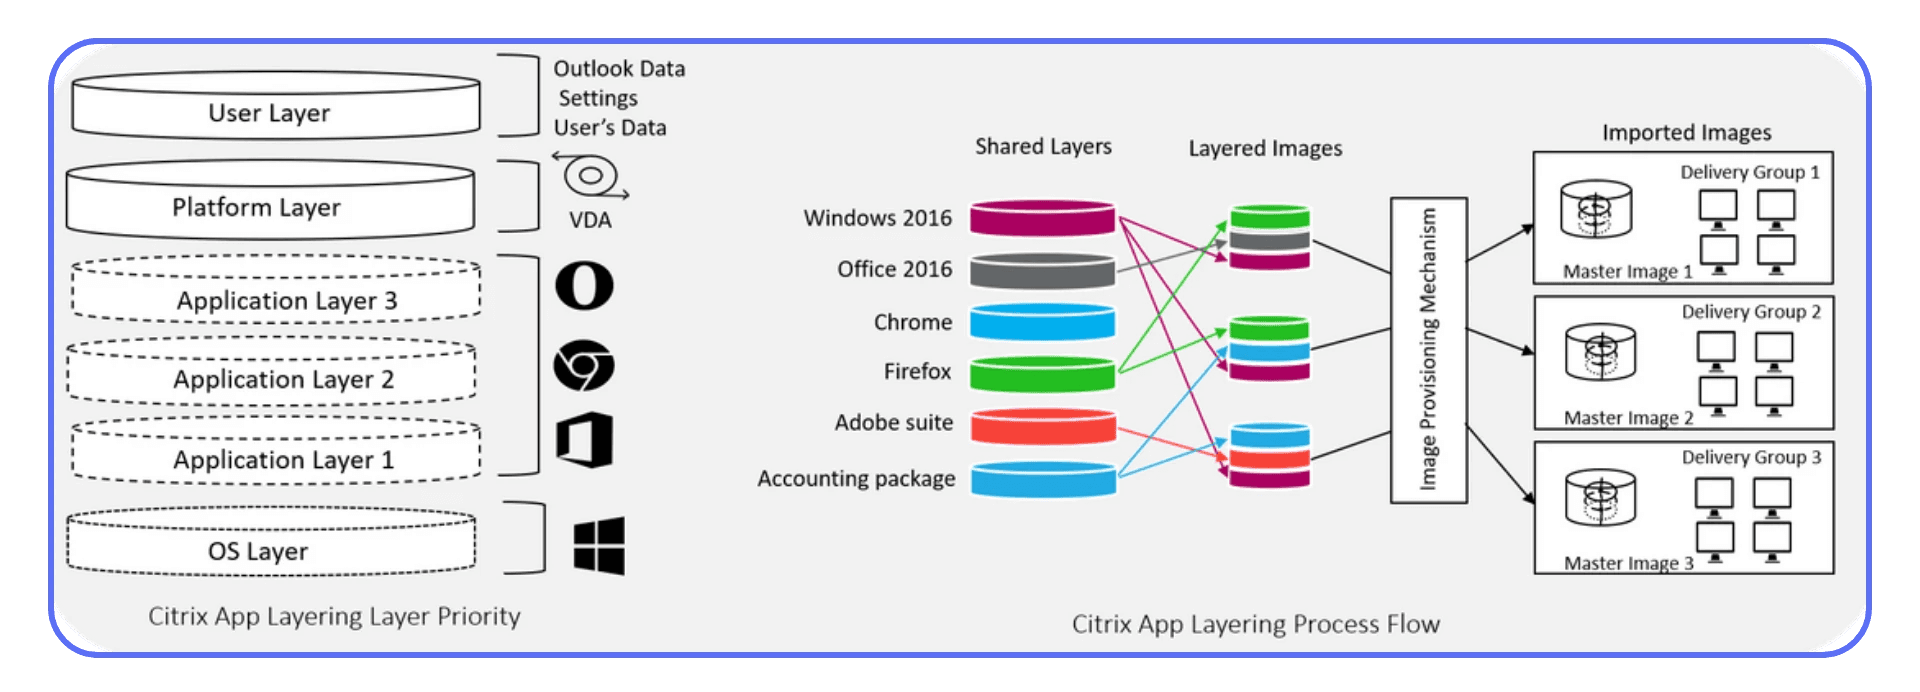
Automation tools like Horizon Image Management Service (IMS), Citrix App Layering, or Azure Image Builder are powerful. They standardize image updates and push consistent builds across pools.
But automation doesn’t excuse oversight. Validate every automated image in a test pool. The best-run environments treat automation as a safety net, not a blindfold.
In short: consistency beats complexity.
A clean, versioned, optimized image isn’t glamorous, but it’s the quiet foundation of uptime. Every minute you spend tightening your patch and image process saves hours of post-incident chaos later.
Strategy 4: Load Management & Scalability
If high availability keeps you online, scalability keeps you responsive.
Most VDI or VM downtime isn’t caused by hardware failure, it’s caused by exhaustion. CPU peaks, RAM saturation, storage queues maxed out, and connection brokers drowning in requests. The system’s technically “up,” but everyone’s frozen.
I’ve seen it happen countless times: Monday 9:00 AM, 400 users log in within a 15-minute window. Storage IOPS spike, logon scripts stall, and suddenly, 400 support tickets appear with one line, “VDI not loading.”
Understand Your Load Profile
You can’t scale what you don’t measure.
Start with baseline metrics:
Average and peak session counts
CPU, RAM, IOPS, and network usage per session
Login storm windows (often at shift starts or after maintenance)
Idle vs active VM ratios
Most admins underestimate concurrency. If you expect 300 users, plan for 350. Someone will always forget to log off, or background agents will keep sessions alive.
Design for Elastic Growth
Static resource allocation works until it doesn’t. Your environment should expand and contract automatically based on load.
VMware Horizon: Use Instant Clone Smart Provisioning with Elastic DRS to scale clusters dynamically.
Citrix DaaS / CVAD: Implement Autoscale policies that power on/off Delivery Group machines based on demand.
Azure Virtual Desktop (AVD): Enable Autoscale in combination with Azure Automation Runbooks for idle session shutdowns and on-demand provisioning.
These systems don’t just save uptime, they save cost. Idle VMs burn resources and licenses that could be scaling on demand instead.
Balance Load Intelligently
Scaling isn’t only about “adding more.” It’s about distributing what you already have.
Load balancing policies matter:
Round-robin is simple, but not efficient.
Least-connection works better for dynamic session counts.
Performance-based balancing, factoring in CPU, latency, or GPU load, is ideal for graphics-heavy workloads like 3D design or rendering.
For Citrix, configure Load Evaluators with metrics beyond session count (CPU, memory, user count).
For Horizon, use Cloud Pod Architecture (CPA) to distribute sessions across multiple pods and sites.
For AVD, monitor with Azure Log Analytics and adjust scaling triggers to match workload behavior.
Plan for Burst Scenarios
Burst load is the real test of your architecture.
Think updates, AI model training, render queues, or even a sudden Windows update rollout, anything that creates simultaneous high CPU/GPU utilization.
Use tiered scaling:
Hot Pool: Always-on VMs for instant logons.
Warm Pool: Pre-staged, powered-off VMs ready for quick spin-up.
Cold Pool: Templates that can be deployed in minutes via automation.
When your environment can flex within those layers, users never see a slowdown, even during unexpected surges.
Keep Performance Feedback Loops
Scaling isn’t set-and-forget. Review utilization trends weekly:
Which clusters hit thresholds most often?
Which applications spike GPU or I/O load?
Are users waiting too long at logon?
Use that data to right-size your resources. Many admins find they can improve performance and reduce cost simultaneously just by eliminating underutilized pools.
When your environment can scale with user demand, without human intervention, downtime shifts from being “inevitable” to “unlikely.”
That’s the moment your infrastructure starts working with you, not against you.
Strategy 5: Network Design & Latency Mitigation
Let’s be honest: when a VDI session lags, users don’t say “network congestion.” They say “the server’s broken.”
That’s how fragile perception is in virtual environments, and how critical the network really is. You can build a perfect VDI stack, but if your packets wander off for 200 ms, it’ll feel like everything’s down.
Latency Is the Real Killer
Bandwidth isn’t usually the bottleneck anymore. Latency, jitter, and packet loss are.
Display protocols like Blast Extreme, HDX, and RDP are surprisingly tolerant, but once latency exceeds 150 ms round-trip, frame loss, audio desync, and input delay start showing up.
The fix starts with measurement. Tools like Citrix Insight Services, VMware Edge Network Intelligence, or Azure Network Watcher let you see latency per hop, not just “it’s slow somewhere.”
Redundant Paths, Always
A single Internet uplink or router is an outage waiting to happen.
Dual ISPs or redundant VPN concentrators give immediate failover.
On-prem environments should use dual top-of-rack switches and redundant NIC teaming on ESXi/Hyper-V hosts.
For multi-site or hybrid setups, SD-WAN solutions (Cisco Viptela, Fortinet Secure SD-WAN, VMware VeloCloud) dynamically reroute traffic based on live latency metrics.
When one link hiccups, users don’t even notice.
Segment and Prioritize Traffic
Treat VDI traffic like a VIP. It shouldn’t compete with Teams calls, backups, or streaming.
Create QoS (Quality of Service) rules prioritizing Blast/ICA/RDP ports.
Separate control traffic (brokers, authentication) from session traffic (display protocol, profile sync).
If you’re cloud-connected, ensure ExpressRoute or VPN tunnels include sufficient bandwidth reservation.
You can’t control the public Internet, but you can make your internal and edge paths predictable.
Optimize the Display Protocol
Every protocol has its knobs:
VMware Blast Extreme: enable H.264/H.265 for GPU offload; adjust frame-rate caps to 30–60 FPS depending on workload.
Citrix HDX: tweak adaptive display, use EDT (Enlightened Data Transport) for UDP acceleration.
RDP (AVD): prefer UDP transport over TCP; enable AVC/H.264 mode for smoother visuals.
These aren’t cosmetic settings, they define how efficiently each pixel travels. A few lines in a policy file can reclaim tens of milliseconds.
Monitor End-to-End, Not Just the Data Center
The weakest link is often outside your firewall, home Wi-Fi, LTE, hotel networks.
Solutions like ControlUp Edge DX, Nexthink, or ThousandEyes extend monitoring to the endpoint, giving you visibility into real user conditions.
When a user in Berlin complains about lag, you can tell whether it’s your broker in Frankfurt or their ISP in Kreuzberg. That context turns panic into problem-solving.
Don’t Forget Security Layers
Security tools can sabotage performance if mis-tuned. SSL inspection, VPN hair-pinning, and packet filtering add milliseconds each.
For remote access, use modern gateways with UDP passthrough and direct protocol acceleration. Avoid stacking multiple proxies just “for safety.” Secure doesn’t have to mean sluggish.
Stable network design isn’t glamorous, but it’s the invisible backbone of every smooth VDI experience. When latency drops and redundancy holds, users stop noticing the infrastructure, which is exactly what you want.
Strategy 6: Backup, Disaster Recovery & Failover Planning
When things really go wrong, and they will, backups and disaster recovery (DR) are what decide whether you’re offline for five minutes or five hours.
I’ve seen environments that looked flawless on paper crumble under a simple host failure because replication hadn’t run in weeks. DR isn’t about if you need it. It’s about when you’ll test it.
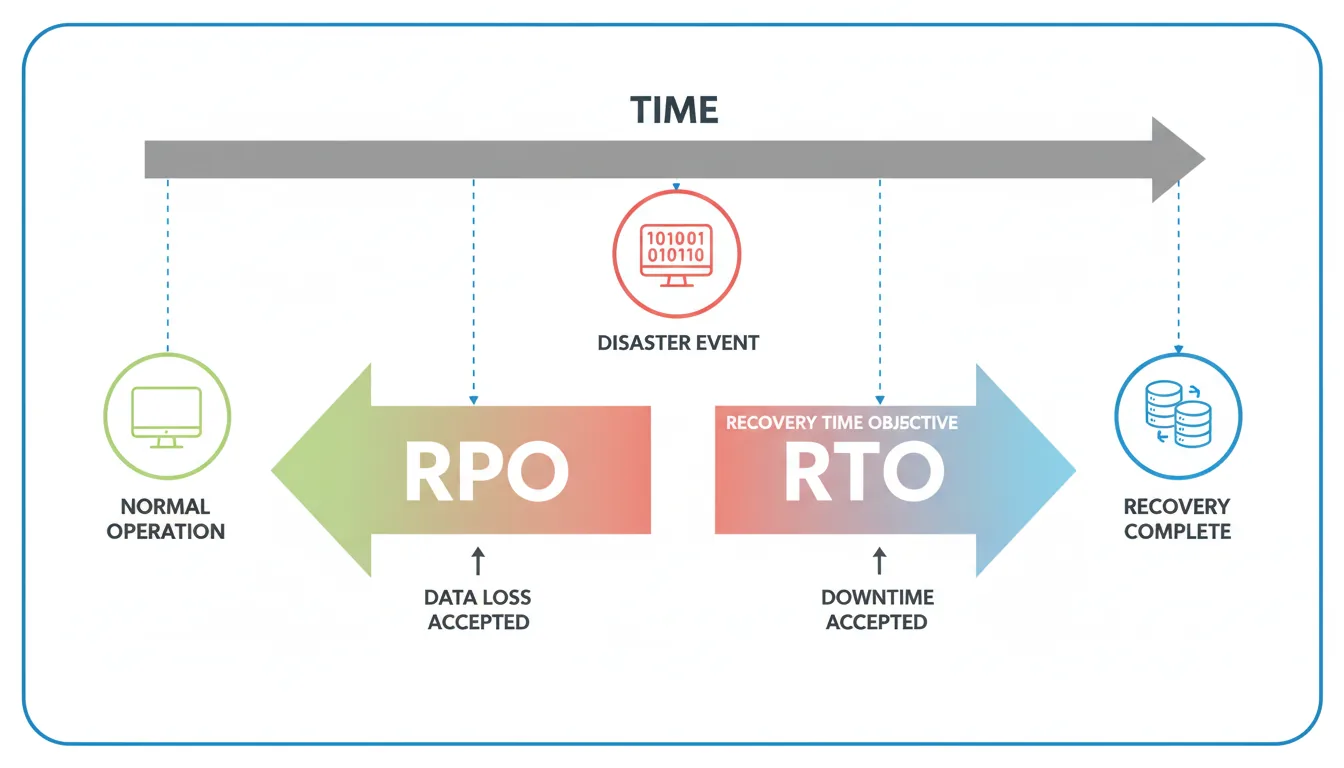
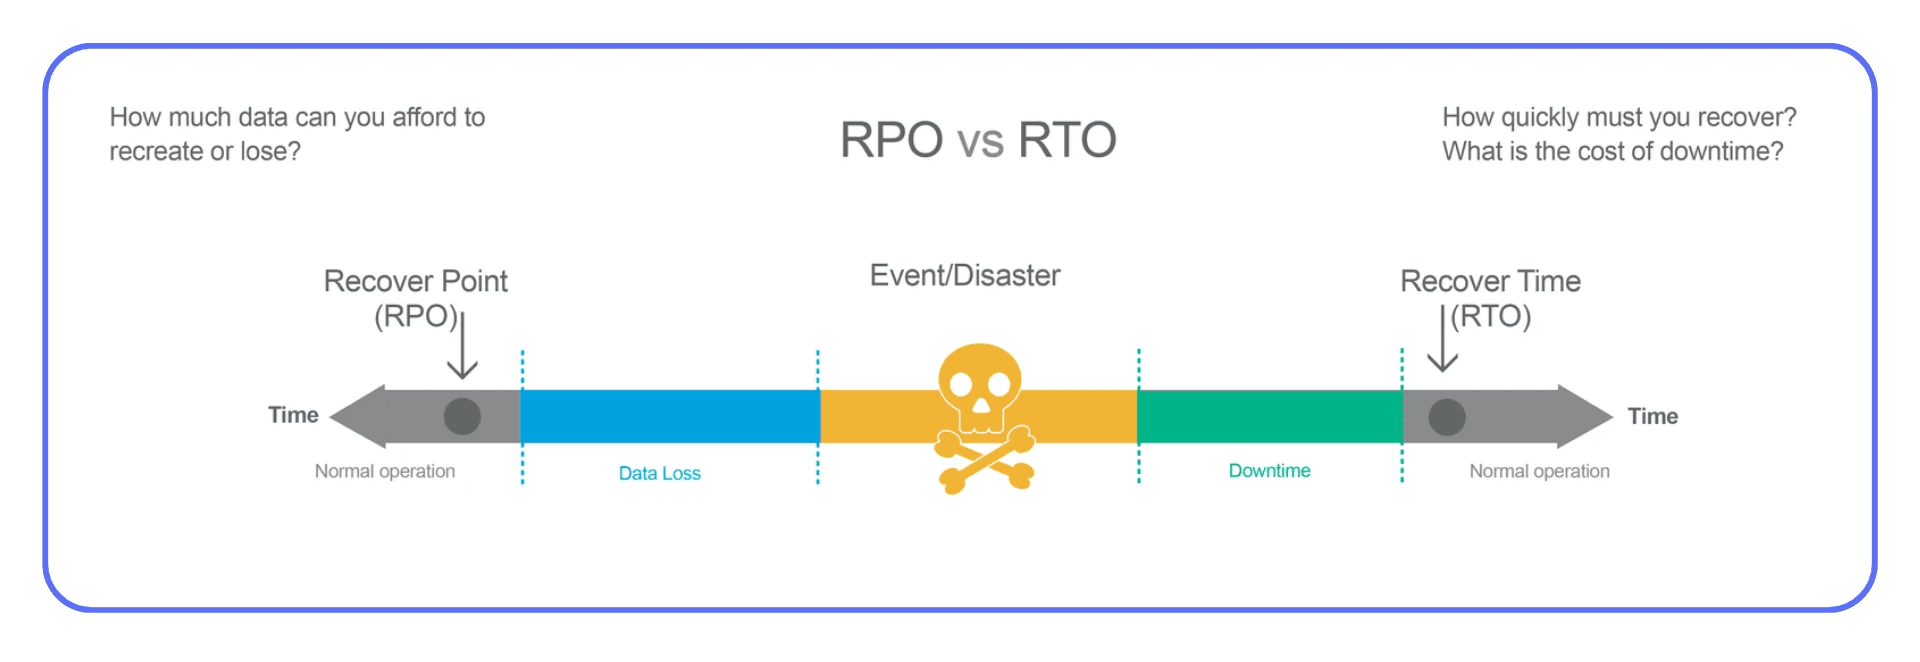
Start with RTO and RPO — and Mean Them
Two acronyms define your recovery posture:
RTO (Recovery Time Objective): How long you can afford to be down.
RPO (Recovery Point Objective): How much data you can afford to lose.
They’re not decoration. They dictate architecture.
If your RTO is 15 minutes but your backup system takes 30 to restore, that’s fantasy, not planning.
Regular Backups Aren’t Enough
Traditional VM snapshots or nightly backups aren’t a DR strategy. They’re a starting point.
For production-grade VDI or VM environments, you need layered protection:
Incremental and full image backups (e.g., Veeam, Altaro, Commvault)
Configuration and broker database backups, Horizon or Citrix Controllers, license servers, and FSLogix profiles
Off-site or cross-region replication to a second data center or cloud zone
Retention rotation (daily, weekly, monthly) for rollback and ransomware isolation
A backup you can’t restore in under an hour isn’t a backup, it’s a liability.
Replication: Synchronous vs. Asynchronous
Replication isn’t one-size-fits-all.
Synchronous replication mirrors data in real time, zero data loss, but higher latency and cost.
Asynchronous replication adds a delay but is more bandwidth-friendly and affordable.
For most Horizon or Citrix setups, asynchronous cross-site replication every few minutes hits the sweet spot between performance and safety.
For AVD, use Azure Site Recovery (ASR) to replicate session hosts and management VMs across paired regions.
Automate Failover — Don’t Rely on Panic
When disaster strikes, no one remembers manual procedures.
Automate failover using:
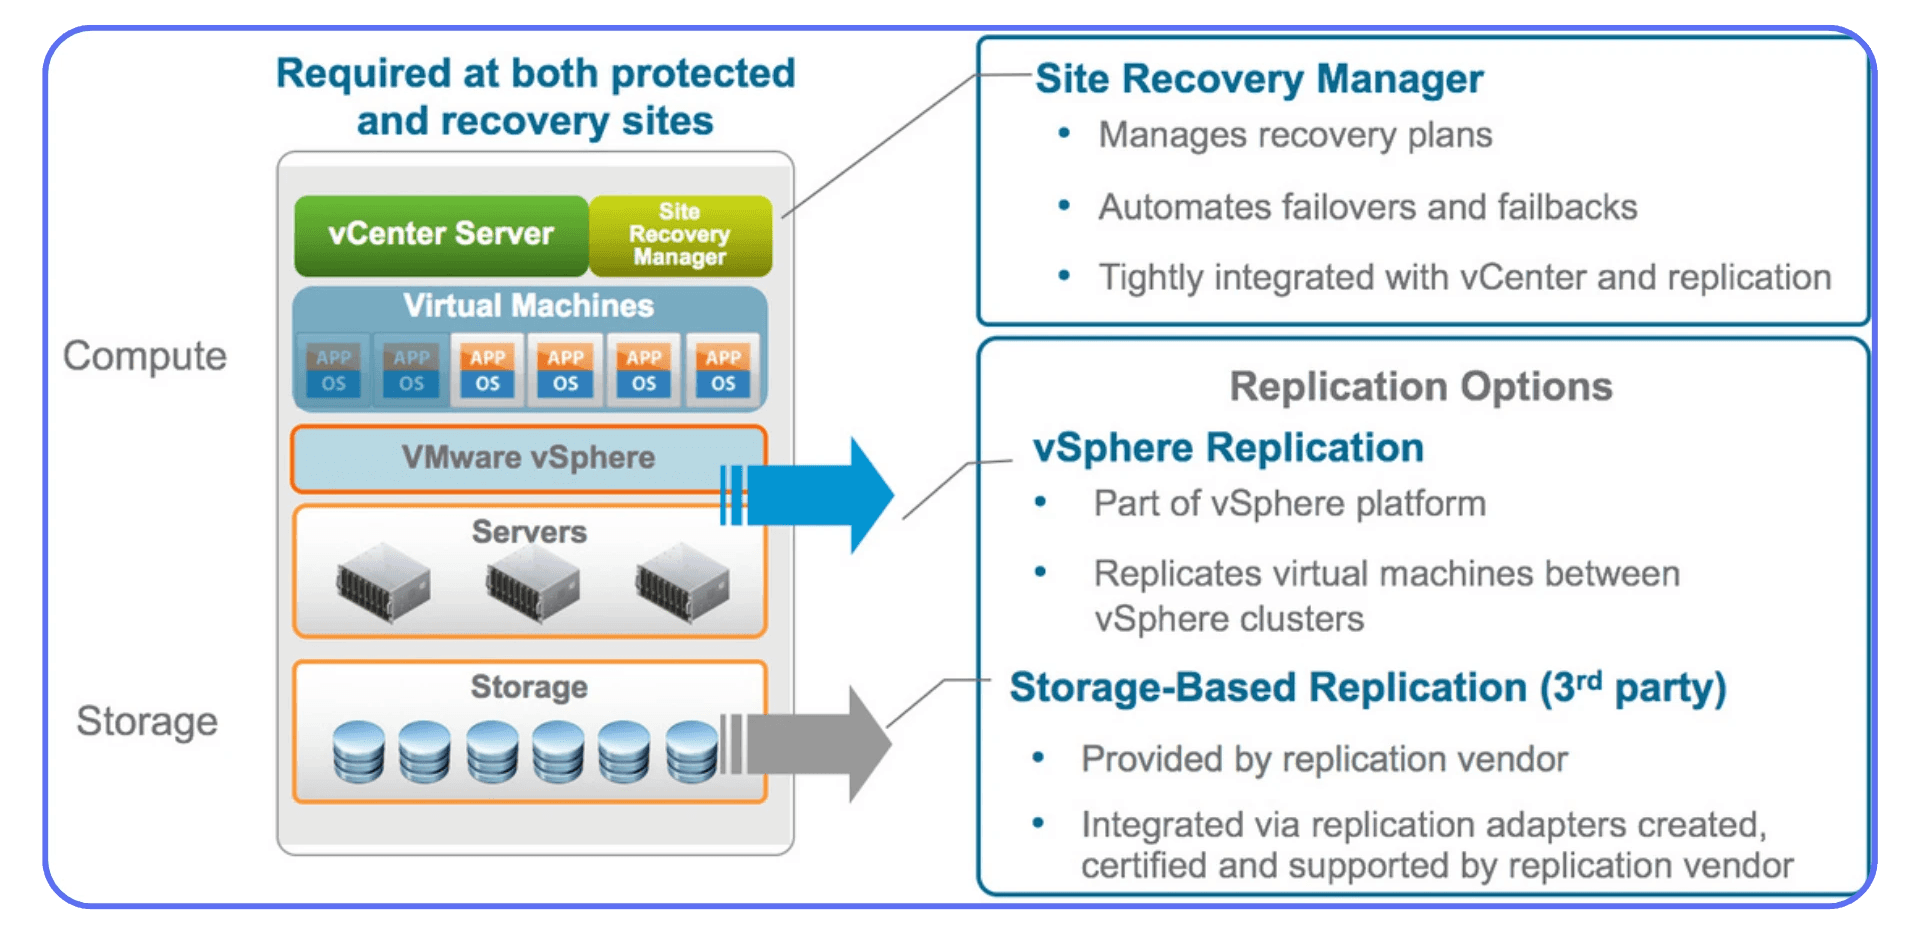
VMware SRM (Site Recovery Manager) for orchestrated recovery
Citrix Autoscale + Delivery Group Failover for cloud and hybrid pools
Azure Site Recovery Runbooks for one-click recovery or region failover
Test quarterly. Don’t assume it’ll “just work.”
Real DR readiness isn’t when everything’s backed up, it’s when you’ve actually restored it successfully under pressure.
Separate Backup from Production
Too many admins store backups on the same SAN or cloud subscription as their live environment. That’s not redundancy, that’s duplication.
Keep backups air-gapped or isolated via separate credentials, network zones, or even providers.
If ransomware hits your control plane, you don’t want it encrypting your last lifeline.
Document Everything
Every step of your recovery should be documented, versioned, and reviewed.
When you’re staring at a black screen and a ticking clock, “tribal knowledge” doesn’t help.
Write it down: which services start first, which credentials are needed, which scripts trigger failover.
The truth about DR is simple: if you haven’t tested it, you don’t have it.
When failure happens, not if, your preparation decides whether users lose minutes or days of productivity.
Strategy 7: Security & Hardening
Most admins think of downtime as a technical failure.
But in the last few years, the most painful outages haven’t come from hardware or software. They’ve come from security incidents.
When your control plane is compromised, downtime isn’t measured in minutes, it’s measured in headlines.
Downtime Starts with Access
The simplest attack path is often the most effective one: credential theft.
If a compromised account can reach your broker, management console, or storage backend, the rest is just automation.
Start with Zero Trust principles:
Require Multi-Factor Authentication (MFA) for all admin and user logins.
Segment management networks from user and application traffic.
Use just-in-time (JIT) admin access where possible (Citrix Cloud, Horizon Cloud, Azure Bastion).
I’ve seen one admin account without MFA bring down hundreds of desktops after a phishing attempt — not because the attacker was sophisticated, but because the perimeter assumed trust.
Harden Your Control Plane
The control layer (brokers, gateways, connection servers) is the brain of your environment. Protect it like one.
Use dedicated management networks, never expose Horizon, Citrix, or AVD management consoles directly to the Internet.
Patch immediately when vendors issue security advisories (especially for Citrix ADC or Horizon Connection Server).
Rotate service account credentials regularly, and avoid domain admin privileges for service bindings.
Disable unused ports and protocols, RDP open to the world is still one of the most common entry points for brute-force bots.
If it’s not in use, close it. Simple as that.
Patch Cadence Without Chaos
Security updates are tricky: skip them, you’re vulnerable; apply them blindly, you might break production.
The fix is structure:
Maintain a staging pool that mirrors production.
Test all patches (OS, agents, hypervisor, display protocols).
Track compatibility matrices, especially GPU driver and VDA versions.
Automate deployment using tools like Ivanti, Ansible, or SCCM, but gate every change behind validation snapshots. Consistency is the real security.
Protect User Profiles & Data
Attackers know users are the soft spot. FSLogix containers, redirected folders, and roaming profiles hold credentials, cookies, and tokens.
Keep these secured:
Encrypt profile shares (SMB signing, at-rest encryption).
Use separate credentials for storage access, never the user’s main login.
Monitor abnormal access patterns (e.g., profile disk mounted twice = red flag).
If ransomware gets into a profile share, replication will happily spread it across your entire cluster. Segmentation is survival.
Monitor, Detect, Respond
Prevention is half the job. The other half is visibility.
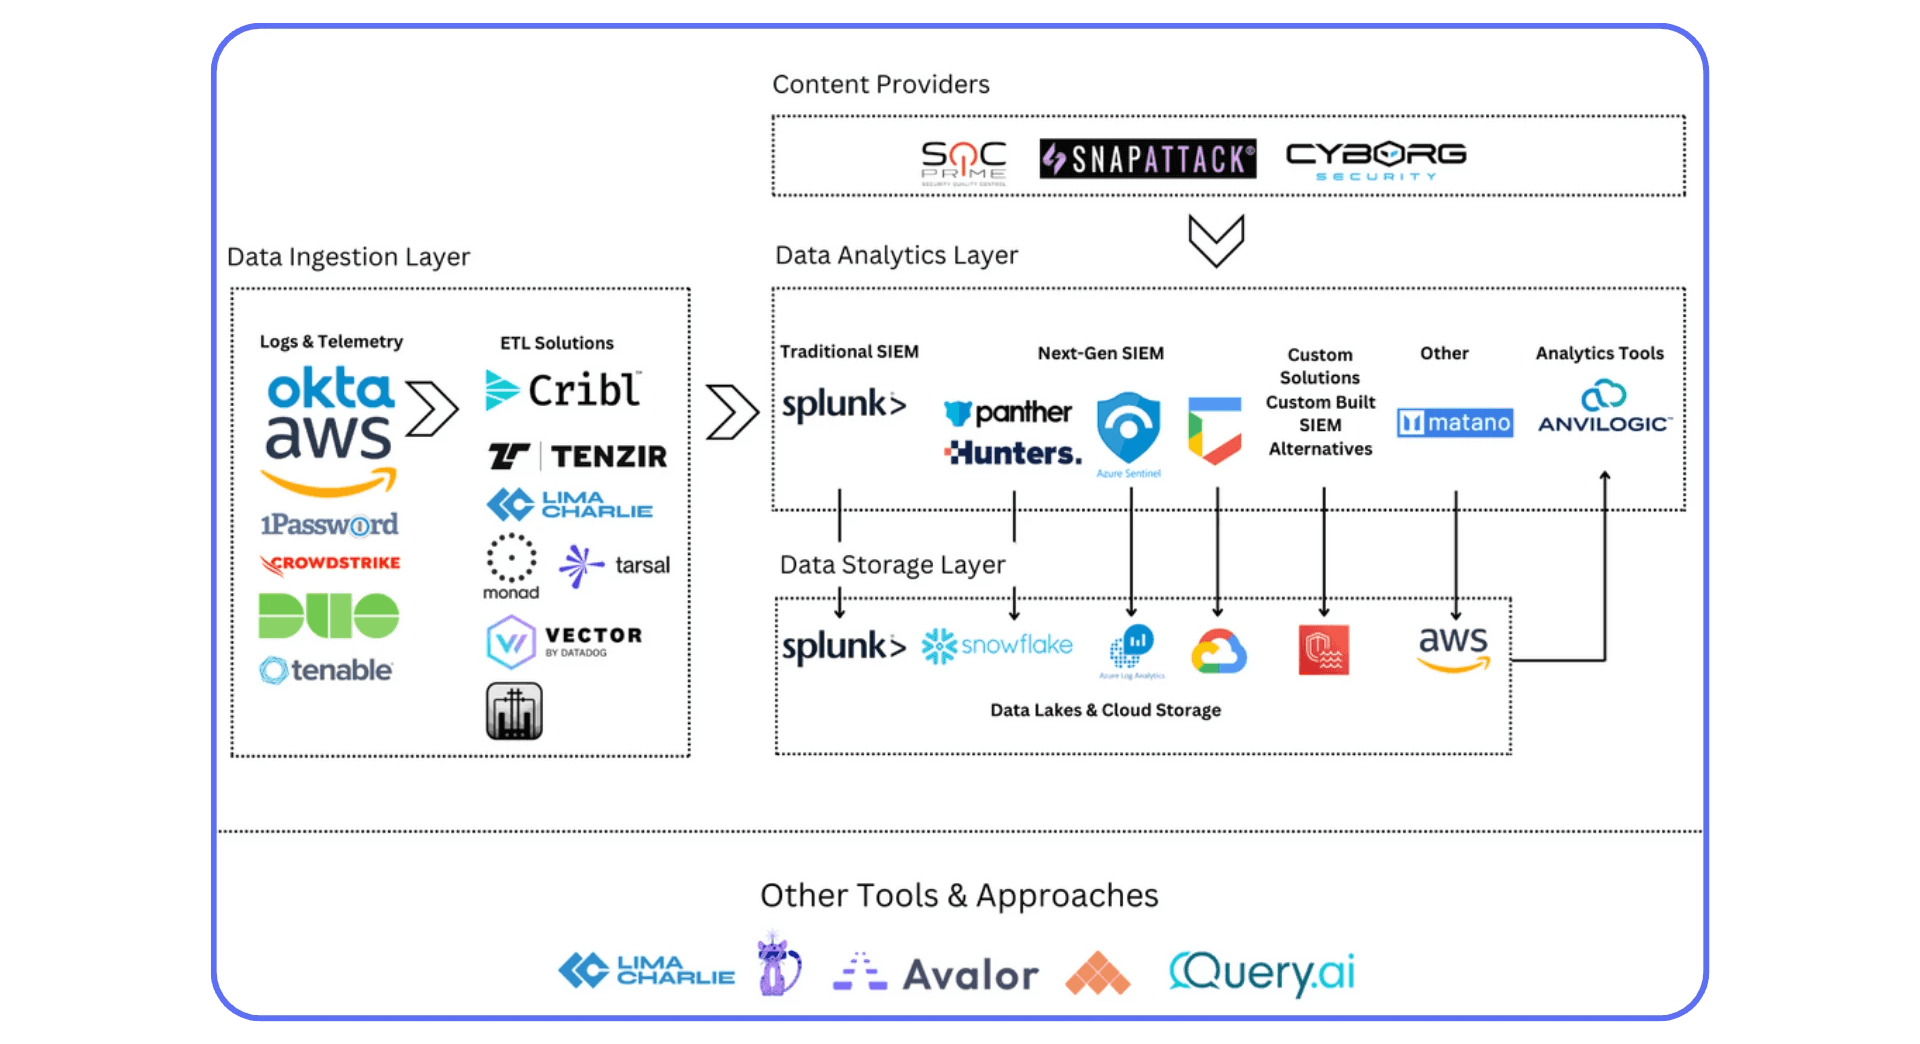
Integrate VDI logs into your SIEM (Splunk, Azure Sentinel, Elastic). Watch for:
Unusual logon patterns
Failed MFA attempts
Elevated privilege grants
Broker or VDA service modifications
Set up alerts that tie directly to actions, like disabling the compromised account or isolating an affected host.
People Are Part of Security
Even the best systems fail if the people running them aren’t aligned.
Run incident response drills. Teach admins how to recognize privilege escalation attempts.
Downtime caused by human error is bad. Downtime caused by human panic is worse.
In a world where downtime and breach often look the same, security is uptime.
The more you isolate, authenticate, and monitor, the less chaos you’ll face when someone, or something, inevitably tests your defenses.
What Doesn’t Work / Common Pitfalls
Every admin has their “never again” story, the one outage that looked small on paper but ended up breaking everything.
After years of helping rebuild environments post-failure, I’ve noticed the same patterns repeating. None of them are technical mysteries. They’re habits.
#1. “We’ll Just Throw More Hardware at It.”
If you’ve ever responded to performance issues by adding another host or upgrading storage tiers without understanding why the system was slow, you’re not alone.
It works for a week. Then it’s back.
Because the real cause usually isn’t capacity, it’s design.
You can’t hardware your way out of misconfigured profiles, image drift, or poor load balancing. Hardware hides problems. It doesn’t solve them.
#2. “If It Ain’t Broke, Don’t Touch It.”
That’s the fastest way to ensure it will break, when you’re least ready.
Static systems age badly. Certificates expire, patches pile up, firmware falls behind, and one day the login page just stops working because TLS versions moved on without you.
VDI environments live on constant change. The safest systems are the ones that evolve deliberately.
#3. Overengineering in the Name of “Resilience”
I’ve seen teams deploy dual SANs, triple brokers, and four-tier failover systems, and still go down because no one could remember which script ran first.
Complexity is the enemy of reliability. Every added layer introduces new dependencies and new ways to fail.
Aim for clear redundancy, not infinite redundancy. If your DR plan needs its own diagram to explain, it’s already fragile.
#4. Ignoring the Human Factor
We talk about uptime like it’s a technical metric. It’s not. It’s cultural.
Downtime often starts with one admin skipping documentation, one team assuming another handled the patch, one forgotten password stored in someone’s notes.
Resilient systems are built by teams who share context. If your only source of truth is tribal knowledge, your next outage is already scheduled.
#5. Untested “Disaster Recovery”
The phrase “we have backups” has caused more panic than comfort.
If you’ve never done a full failover test, you don’t have DR, you have hope.
Restoration isn’t the time to discover that your backup repository was encrypted with production credentials.
Schedule simulated failures quarterly. Pull a host offline, restore a snapshot, rebuild a broker. Confidence doesn’t come from documentation, it comes from repetition.
#6. Security Theater
Plenty of teams “lock down” their environment with 15 passwords, nested firewalls, and SSL inspection, then open RDP to the Internet for “temporary support access.”
That’s not security. That’s wishful thinking.
Real protection comes from isolation, MFA, and proper segmentation, not paperwork.

#7. Chasing Perfection Instead of Progress
I’ve seen admins spend months designing “zero downtime” architectures that never launch because the design phase never ends.
Here’s the truth: you’ll never eliminate every single point of failure. Focus on reducing blast radius, not reaching mythical perfection.
Downtime isn’t a single event, it’s a series of ignored warnings.
The good news? Every pitfall above can be fixed with process, visibility, and discipline.
And once you’ve covered those foundations, you’re ready for the final layer, turning your uptime lessons into shareable experience for your entire team.
Where Vagon Teams Fits
Even when you do everything right, redundant systems, flawless images, tuned networks, downtime still happens.
A service hangs. A session freezes. A user insists “it’s broken again” even though all your dashboards are green.
That’s where visibility becomes your last line of defense.
Not just infrastructure visibility, experience visibility.
Seeing What Users Actually See
Here’s the truth every VDI admin knows: metrics only tell half the story.
You can have perfect CPU graphs and zero alert noise while a designer’s workspace crawls because of a display driver glitch or profile container delay.
That’s why we built Vagon Teams to bridge that gap, not as another monitoring tool, but as a way to see what your users experience.
Instead of reading log files or replaying guesses, you can watch how sessions behave, how long apps take to launch, when lag appears, and where performance drops.
It’s like having a time machine for troubleshooting.
Turning Downtime Into Data
The hardest part of post-incident reviews is always the same: what exactly happened?
Vagon Teams helps teams document and share that, with real session data, replayable context, and performance metrics that go beyond “it was slow.”
That makes collaboration between IT, support, and engineering faster, and turns every incident into an opportunity to improve the system, not just patch it.
You don’t replace your existing tools. You augment them, adding a human layer of visibility on top of your VDI or VM stack.
It’s how admins move from reacting to understanding.
Sharing the Lessons That Keep Systems Up
Downtime prevention isn’t just architecture, it’s culture.
Vagon Teams gives you a way to capture experiences, annotate issues, and share them internally, so your whole organization learns from real events instead of repeating them.
When teams see the same data, not anecdotes, conversations change. Blame disappears, and uptime gets real.
Even the most resilient infrastructure can fail quietly.
But when you can see, share, and learn from every user experience, you stop chasing ghosts and start building confidence.
That’s what Vagon Teams is designed for, helping great systems stay that way.
Final Thoughts
Downtime changes the way you see systems. Before it happens, uptime feels like a number, a percentage to keep above 99%. But once it hits, you realize it’s never really about numbers. It’s about trust. The trust users have in the tools you manage. The trust your team has in the systems they’ve built. And the trust leadership has that everything will keep running, even when something breaks.
That’s the paradox of great infrastructure, when it works perfectly, nobody notices. You only hear about it when it fails. The truth is, preventing downtime isn’t a single project you complete and move on from. It’s a practice. A habit. It’s the mindset of designing for failure instead of pretending it won’t happen, of versioning every change, testing every failover, and documenting every fix.
Perfection isn’t the goal, resilience is. Resilient systems bend without breaking. They recover without panic. They teach you something every time they’re tested. The best teams I’ve seen share that same quiet discipline: they monitor everything, but don’t drown in alerts. They document relentlessly, but never stop improving. And when something fails, they treat downtime as feedback, not as failure.
If you can build that mindset into your virtual environments, uptime stops being a metric on a dashboard. It becomes a habit, a reflection of how your team works, not just how your systems perform. And that’s when the work you do behind the screens finally pays off, quietly, reliably, every single day.
Key Takeaway: The strongest VDI and VM infrastructures aren’t the ones that never fail. They’re the ones that learn faster than they break.
FAQs
1. What’s the most common cause of VDI downtime?
Usually, it’s not hardware. It’s configuration drift or a single overlooked dependency, like an expired certificate, overloaded broker, or storage misalignment. Most major outages start with something that looked “too small to matter.”
2. How often should I test failover or DR scenarios?
At least once every quarter. Once a year isn’t enough, too many dependencies change silently. Test failovers under real conditions: pull the plug on a broker, simulate a site outage, time your recovery.
3. How do I know if my network is the bottleneck?
Watch for user reports that mention “lag” or “delay” instead of “crash.” Use protocol analytics, Citrix HDX Insight, VMware Blast Analyzer, or Azure Network Watcher, to track latency, jitter, and packet loss. Anything over 150 ms round-trip will feel broken to end users.
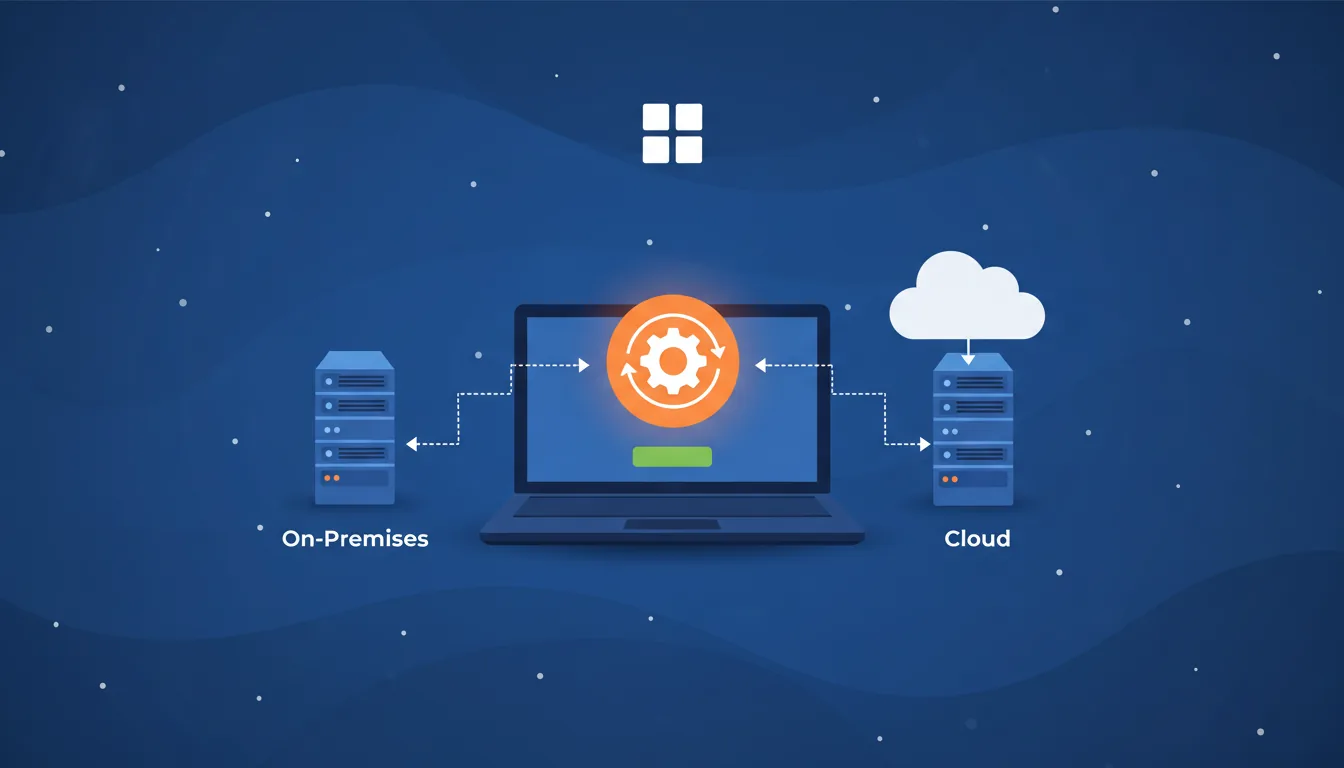
4. What’s better for uptime, on-prem VDI or cloud-based VM solutions?
Neither is automatically “better.” On-prem gives you full control, but cloud platforms (like AVD or Horizon Cloud) often provide built-in redundancy and elasticity. The best setups are hybrid: local control for performance, cloud backup for resilience.
5. How can small teams implement redundancy affordably?
Focus on the control plane first. Two connection brokers, replicated databases, and off-site backups will give you more real-world uptime than a full multi-site cluster you can’t maintain. Redundancy doesn’t have to mean enterprise-level spend.
6. What’s the ideal patching frequency for VDI environments?
Monthly for OS and security updates, quarterly for platform components, always after staging validation. Use snapshots before applying any patch. Fast patching looks proactive, but untested patching creates its own downtime.
7. How do I monitor end-user experience effectively?
Combine infrastructure monitoring (CPU, IOPS, broker health) with session-level telemetry, logon time, frame latency, dropped frames. Tools like ControlUp, Citrix Director, or Vagon Teams can help you see what users actually experience instead of relying on averages.
8. Can downtime be eliminated entirely?
No, and chasing that illusion is how teams over-engineer themselves into chaos. The goal isn’t zero downtime; it’s predictable downtime. Build systems that fail gracefully, recover quickly, and teach you something every time they do.
9. How does Vagon Teams help in downtime prevention?
By showing what your dashboards can’t: real user experience. It captures performance data, logs, and session behaviors, so you can see exactly what users saw before an issue occurred. It turns downtime into a learning loop, fast, visual, and collaborative.
10. What’s one simple practice that reduces downtime across every platform?
Documentation. Write down everything, image versions, patch notes, network configs, and failover procedures. When things break, written knowledge restores faster than memory every time.
A few years ago, I watched 30% of our users get locked out of their desktops for nearly an hour, all because one storage controller in a VMware vSAN cluster hit a firmware bug during replication.
No catastrophic power failure. No ransomware attack. Just a single array hiccup that cascaded through the Horizon Connection Server pool, froze the broker queue, and left users staring at gray login screens.
By the time we restored service, the helpdesk queue looked like a DoS attack. Designers couldn’t open Adobe apps, analysts lost R sessions mid-calculation, and our QA team on Citrix couldn’t access a single VM. The infrastructure team fixed it within 45 minutes. But it took weeks to rebuild confidence.
That’s the real cost of downtime.
In a VDI or VM environment, even “minor” interruptions ripple fast. They don’t just frustrate end users, they break the illusion that your virtual workspace is as stable as a physical one. Whether you’re running Citrix Virtual Apps, Horizon, or Azure Virtual Desktop, uptime isn’t a checkbox. It’s a discipline.
And preventing downtime isn’t about buying more hardware or paying for “99.999%” SLAs. It’s about designing your environment to expect failure, and recover from it before users even notice.
In this post, I’ll walk you through the key strategies that have actually worked across real deployments, from storage redundancy and session brokering, to image drift control and predictive monitoring. These are the lessons that keep environments stable, users productive, and admins sane.
Why Downtime Happens
Every admin learns this the hard way: virtual environments don’t just “go down” out of nowhere. There’s always a chain reaction, usually triggered by something small that snowballs.
Sometimes it’s predictable. Sometimes it’s embarrassing. Usually, it’s both.
#1. Single Points of Failure
You can have redundant hosts, but if your broker, profile server, or storage path isn’t replicated, you’re one reboot away from a full outage. I’ve seen entire Horizon pods stall because a single Connection Server certificate expired. That’s not a hardware failure. That’s planning failure.
#2. Resource Contention & Mis-sizing
It’s easy to underestimate peak loads. Monday mornings, large updates, or even AI-powered tools suddenly added to user profiles, all can push CPU, RAM, or IOPS beyond thresholds. When you hear “the VM is slow” right before it dies, it’s usually resource contention.
#3. Image & Patch Drift
Your “golden image” worked perfectly on day one. But six months and thirty silent updates later, half your machines start misbehaving. Patch drift and inconsistent images create instability that’s almost invisible until login storms hit.
#4. Network & Latency Bottlenecks
Bandwidth is rarely the problem, latency and jitter are. A few milliseconds of delay on session brokers or display protocol traffic (Blast, ICA, RDP) can lock up entire sessions. Then users assume “the server’s down.”
#5. Misconfiguration & Human Error
We love automation until it deploys the wrong GPO to production. I’ve seen admins update a single registry setting across a pooled image and accidentally disable logon for hundreds of VMs. Humans remain the most efficient cause of downtime.
#6. Security Incidents & Patching Gaps
Ironically, patching to prevent breaches can also cause downtime, especially when agents, antivirus hooks, or credential providers conflict with the VDI agent. But the reverse is worse: unpatched brokers are an open door for ransomware.
#7. External Dependencies
DNS failures, authentication servers, profile disks, license managers, all external, all critical. Lose one, and your “virtual infrastructure” becomes a museum exhibit.
The bottom line?
Downtime is rarely a single failure. It’s usually a perfect storm of overlooked dependencies, human shortcuts, and assumptions that “this part never fails.”
Strategy 1: Architect for High Availability & Redundancy
If there’s one thing that separates stable environments from fragile ones, it’s how they handle failure, not whether they avoid it. Hardware dies, services crash, sessions freeze. High availability (HA) isn’t about eliminating risk. It’s about making sure users never feel it.
Eliminate Single Points of Failure
Start here.
Redundant brokers, redundant gateways, redundant storage paths. Anything less is gambling.
In Citrix, that means multiple Delivery Controllers. In Horizon, it’s Connection Server replicas and multiple Unified Access Gateways. For AVD, it’s ensuring load-balanced session hosts and multiple Azure regions when possible.
Your goal: no single host, NIC, or service should decide your uptime.
A misconfigured DNS record or broken certificate chain shouldn’t take down your entire desktop pool. Spread your dependencies. Even small teams can use two lightweight brokers on separate VMs, it’s cheap insurance.
Separate the Layers
Your VDI stack has distinct tiers:
Control Plane (Brokers, Licensing, DBs) → Compute Plane (Hypervisors, VMs) → Storage & Profile Services → Networking & Access.
If you mix them or collapse roles “for simplicity,” a failure in one tier can cascade through everything.
Keep them logically and physically isolated where possible. If your broker and profile share the same datastore, you’ve already lost redundancy.
Load Balancing Isn’t Optional
Redundancy without load balancing is like having a spare tire you never install.
Use proven solutions:
Citrix ADC / NetScaler or F5 BIG-IP for broker and gateway load balancing
VMware NSX or HAProxy for Horizon connection servers
Azure Front Door / Load Balancer for AVD session hosts
Distribute traffic intelligently, not round-robin blindly. Weighted and health-aware load balancing saves you from uneven load spikes and the dreaded “half the users can’t log in” scenario.
Active-Active vs. Active-Passive
Active-Passive failover is cheaper, but recovery isn’t instant. You’re relying on monitoring to trigger switchover.
Active-Active, on the other hand, gives real resilience, both sites or clusters serving users simultaneously. It’s how large-scale Horizon or Citrix environments reach near-zero RTOs (Recovery Time Objectives).
If you can’t afford a full secondary site, at least design your storage and brokers for cluster-level failover. VMware vSAN, Hyper-V clustering, or Nutanix AHV make this attainable even for mid-sized setups.
Test the Failures You Think You’ve Covered
Every team says they have redundancy. Few actually test it.
Pull the plug on a broker. Disable a datastore. Watch what happens.
If your users feel even a brief pause, your HA plan isn’t ready.
Document your expected RTO (how long to recover) and RPO (how much data loss is tolerable), then measure real numbers. You’ll probably be surprised.
Keep It Practical
Redundancy can easily become overengineering. I’ve seen teams build “bulletproof” clusters that are impossible to maintain. The goal isn’t perfection, it’s resilience. A system that fails gracefully beats one that never fails until it catastrophically does.
The takeaway: You can’t prevent every fault. But you can design your environment so a fault never becomes downtime.
Strategy 2: Proactive Monitoring, Observability & Predictive Analytics
Most environments don’t fail suddenly. They fail gradually, CPU creeping up for days, latency spikes ignored, logins taking a few seconds longer every week. Then one morning, it all collapses and someone says, “It happened out of nowhere.”
Except it didn’t. You just weren’t looking in the right place.
Beyond “Is It Up?”
Traditional monitoring asks one question: Is the server alive?
Modern observability asks: How healthy is the experience?
There’s a difference between a VM being “online” and a user being productive.
You can ping a broker all day and get green checks, while your login process takes 90 seconds because the profile disk is choking on IOPS. That’s why VDI monitoring needs to include end-user experience metrics, not just infrastructure uptime.
Build Layered Visibility
Think in tiers:
Hardware/Hypervisor Metrics: CPU, RAM, disk IOPS, NIC saturation.
VM Metrics: Guest OS performance, agent health, session count.
User Session Metrics: Logon time, protocol latency, dropped frames, reconnects.
Application Metrics: Launch times, error frequency, crash ratios.
If you only monitor one layer, you’ll always chase the wrong issue. I once saw a Citrix farm blamed for “slow sessions” when the real culprit was a misconfigured profile share on a DFS namespace. Without layered telemetry, that kind of root cause takes days to find.
Tools That Actually Help
You don’t need a dozen dashboards, you need correlation.
Here’s what works in practice:
ControlUp and Lakeside SysTrack — deep session-level visibility for Citrix & Horizon.
VMware Aria Operations for Horizon — integrates vCenter + Horizon analytics in one pane.
Azure Monitor & Log Analytics — for AVD session host performance, connection diagnostics, and FSLogix profiles.
Prometheus + Grafana — open-source stack for custom metrics pipelines (especially for hybrid or Nutanix-based environments).
Whatever stack you use, centralize logs. Fragmented data is useless during an incident.
Catch Issues Before They Escalate
Modern monitoring tools now include predictive analytics, ML-based trend detection that spots anomalies before they become downtime.
Things like:
CPU saturation trending over X% for Y hours
Storage latency rising faster than throughput
Logon time deviation from baseline > 20%
VM snapshot accumulation leading to datastore exhaustion
You don’t need AI buzzwords to do this, just good baselines and alert thresholds that evolve. A “smart” alert is one that triggers once and matters.
Automate Response Loops
Detection without reaction is noise. Tie your monitoring to actions.
If a Horizon pod exceeds CPU thresholds, trigger a PowerCLI script to start another ESXi host. If Citrix latency hits 200ms, auto-drain one Delivery Controller.
Automation turns observability into resilience.
Make It Part of Culture
Monitoring isn’t a one-time setup; it’s a feedback loop. Teams should review weekly trends, user satisfaction data, and anomaly logs. The goal isn’t just to prevent downtime, it’s to predict it, measure it, and understand it.
When your monitoring matures from “uptime” to “experience,” you stop firefighting and start forecasting. That’s where downtime prevention actually begins.
Strategy 3: Image & Patch Management Discipline
If you’ve ever spent an entire afternoon chasing random logon errors, only to realize half your VMs were running different builds of the same image, congratulations, you’ve met image drift. It’s silent, sneaky, and one of the most common causes of downtime in virtual environments.
Keep One Golden Image — and Guard It Like a Vault
Everything starts with a clean, controlled “golden image.”
That’s your blueprint. Every VM, every session host, every desktop should originate from that single, hardened, optimized base.
For VMware Horizon, that’s your Instant Clone parent image.
For Citrix, your Master Image or MCS snapshot.
For AVD, your Shared Image Gallery version.
The problem? People start making “minor tweaks”, an agent update here, a driver change there. Over a few months, your “standard build” turns into five untraceable variants. Then one day, logins hang or the display driver crashes, and you have no idea which version broke it.
Lock it down. Use version control. Keep a changelog.
Patch Like a Scientist, Not Like a Hero
There’s a difference between being fast and being reckless.
Patching directly in production because Microsoft released “critical updates” last night isn’t maintenance — it’s gambling.
The disciplined approach looks like this:
Test Environment: Maintain a small clone of your production pool for patch validation.
Automate Patching Windows: Use tools like Ivanti, SCCM, or Azure Update Management to stage rollouts.
Snapshot Before Deployment: Always keep a rollback point, especially for GPU or driver-level updates.
Staggered Release: Apply patches to a limited host group first, observe for anomalies, then scale.
This approach might sound slow, but it’s far cheaper than rolling back hundreds of broken VMs at 2 a.m.
Strip the Bloat — Optimize for Performance
A smaller image means fewer moving parts to break. Remove unnecessary apps, services, scheduled tasks, and telemetry that slow down startup or conflict with your VDI agent.
Microsoft even provides an official VDI Optimization Script that trims Windows 10/11 for non-persistent environments.
In Horizon, disabling non-critical services can cut logon time by 15–25%.
In AVD, reducing background updates improves FSLogix container mounting reliability.
In Citrix, it helps avoid profile bloat and excessive I/O on logon.
Keep Versions, Not “Mystery Images”
Label and archive every version of your image with:
Build date
OS + agent version
Installed app set
Known issues or dependencies
When something breaks, you should be able to say, “Roll back to v2025.09.03,” not “Revert to that old VM we think worked fine last month.”
Automate Where Possible — But Validate Always
Automation tools like Horizon Image Management Service (IMS), Citrix App Layering, or Azure Image Builder are powerful. They standardize image updates and push consistent builds across pools.
But automation doesn’t excuse oversight. Validate every automated image in a test pool. The best-run environments treat automation as a safety net, not a blindfold.
In short: consistency beats complexity.
A clean, versioned, optimized image isn’t glamorous, but it’s the quiet foundation of uptime. Every minute you spend tightening your patch and image process saves hours of post-incident chaos later.
Strategy 4: Load Management & Scalability
If high availability keeps you online, scalability keeps you responsive.
Most VDI or VM downtime isn’t caused by hardware failure, it’s caused by exhaustion. CPU peaks, RAM saturation, storage queues maxed out, and connection brokers drowning in requests. The system’s technically “up,” but everyone’s frozen.
I’ve seen it happen countless times: Monday 9:00 AM, 400 users log in within a 15-minute window. Storage IOPS spike, logon scripts stall, and suddenly, 400 support tickets appear with one line, “VDI not loading.”
Understand Your Load Profile
You can’t scale what you don’t measure.
Start with baseline metrics:
Average and peak session counts
CPU, RAM, IOPS, and network usage per session
Login storm windows (often at shift starts or after maintenance)
Idle vs active VM ratios
Most admins underestimate concurrency. If you expect 300 users, plan for 350. Someone will always forget to log off, or background agents will keep sessions alive.
Design for Elastic Growth
Static resource allocation works until it doesn’t. Your environment should expand and contract automatically based on load.
VMware Horizon: Use Instant Clone Smart Provisioning with Elastic DRS to scale clusters dynamically.
Citrix DaaS / CVAD: Implement Autoscale policies that power on/off Delivery Group machines based on demand.
Azure Virtual Desktop (AVD): Enable Autoscale in combination with Azure Automation Runbooks for idle session shutdowns and on-demand provisioning.
These systems don’t just save uptime, they save cost. Idle VMs burn resources and licenses that could be scaling on demand instead.
Balance Load Intelligently
Scaling isn’t only about “adding more.” It’s about distributing what you already have.
Load balancing policies matter:
Round-robin is simple, but not efficient.
Least-connection works better for dynamic session counts.
Performance-based balancing, factoring in CPU, latency, or GPU load, is ideal for graphics-heavy workloads like 3D design or rendering.
For Citrix, configure Load Evaluators with metrics beyond session count (CPU, memory, user count).
For Horizon, use Cloud Pod Architecture (CPA) to distribute sessions across multiple pods and sites.
For AVD, monitor with Azure Log Analytics and adjust scaling triggers to match workload behavior.
Plan for Burst Scenarios
Burst load is the real test of your architecture.
Think updates, AI model training, render queues, or even a sudden Windows update rollout, anything that creates simultaneous high CPU/GPU utilization.
Use tiered scaling:
Hot Pool: Always-on VMs for instant logons.
Warm Pool: Pre-staged, powered-off VMs ready for quick spin-up.
Cold Pool: Templates that can be deployed in minutes via automation.
When your environment can flex within those layers, users never see a slowdown, even during unexpected surges.
Keep Performance Feedback Loops
Scaling isn’t set-and-forget. Review utilization trends weekly:
Which clusters hit thresholds most often?
Which applications spike GPU or I/O load?
Are users waiting too long at logon?
Use that data to right-size your resources. Many admins find they can improve performance and reduce cost simultaneously just by eliminating underutilized pools.
When your environment can scale with user demand, without human intervention, downtime shifts from being “inevitable” to “unlikely.”
That’s the moment your infrastructure starts working with you, not against you.
Strategy 5: Network Design & Latency Mitigation
Let’s be honest: when a VDI session lags, users don’t say “network congestion.” They say “the server’s broken.”
That’s how fragile perception is in virtual environments, and how critical the network really is. You can build a perfect VDI stack, but if your packets wander off for 200 ms, it’ll feel like everything’s down.
Latency Is the Real Killer
Bandwidth isn’t usually the bottleneck anymore. Latency, jitter, and packet loss are.
Display protocols like Blast Extreme, HDX, and RDP are surprisingly tolerant, but once latency exceeds 150 ms round-trip, frame loss, audio desync, and input delay start showing up.
The fix starts with measurement. Tools like Citrix Insight Services, VMware Edge Network Intelligence, or Azure Network Watcher let you see latency per hop, not just “it’s slow somewhere.”
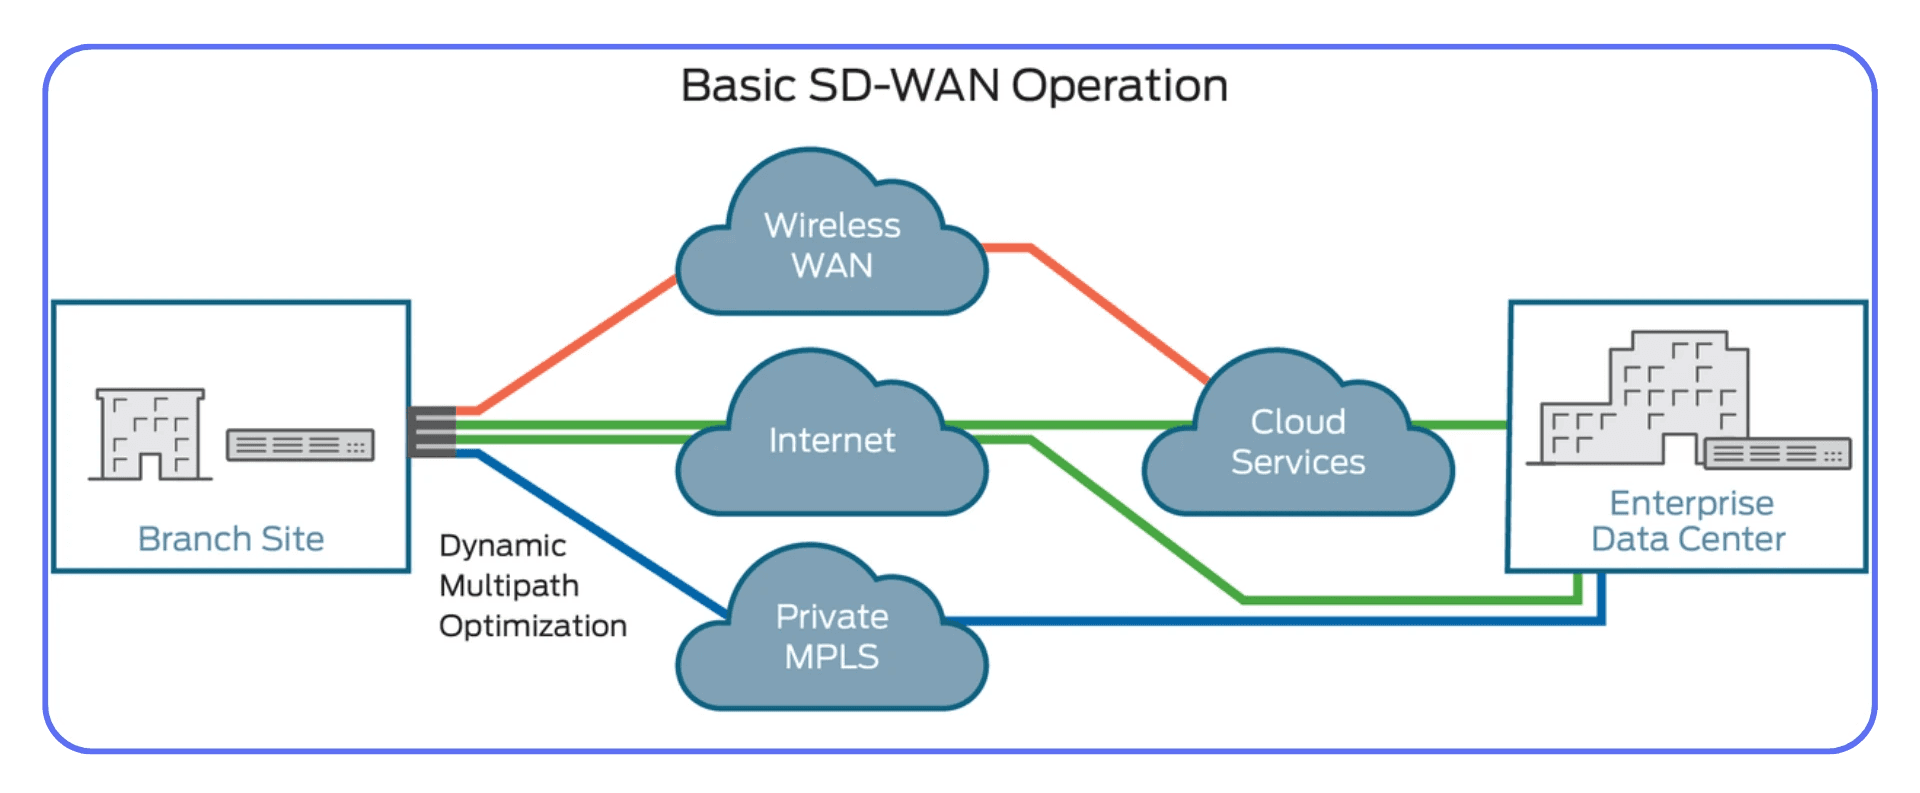
Redundant Paths, Always
A single Internet uplink or router is an outage waiting to happen.
Dual ISPs or redundant VPN concentrators give immediate failover.
On-prem environments should use dual top-of-rack switches and redundant NIC teaming on ESXi/Hyper-V hosts.
For multi-site or hybrid setups, SD-WAN solutions (Cisco Viptela, Fortinet Secure SD-WAN, VMware VeloCloud) dynamically reroute traffic based on live latency metrics.
When one link hiccups, users don’t even notice.
Segment and Prioritize Traffic
Treat VDI traffic like a VIP. It shouldn’t compete with Teams calls, backups, or streaming.
Create QoS (Quality of Service) rules prioritizing Blast/ICA/RDP ports.
Separate control traffic (brokers, authentication) from session traffic (display protocol, profile sync).
If you’re cloud-connected, ensure ExpressRoute or VPN tunnels include sufficient bandwidth reservation.
You can’t control the public Internet, but you can make your internal and edge paths predictable.
Optimize the Display Protocol
Every protocol has its knobs:
VMware Blast Extreme: enable H.264/H.265 for GPU offload; adjust frame-rate caps to 30–60 FPS depending on workload.
Citrix HDX: tweak adaptive display, use EDT (Enlightened Data Transport) for UDP acceleration.
RDP (AVD): prefer UDP transport over TCP; enable AVC/H.264 mode for smoother visuals.
These aren’t cosmetic settings, they define how efficiently each pixel travels. A few lines in a policy file can reclaim tens of milliseconds.
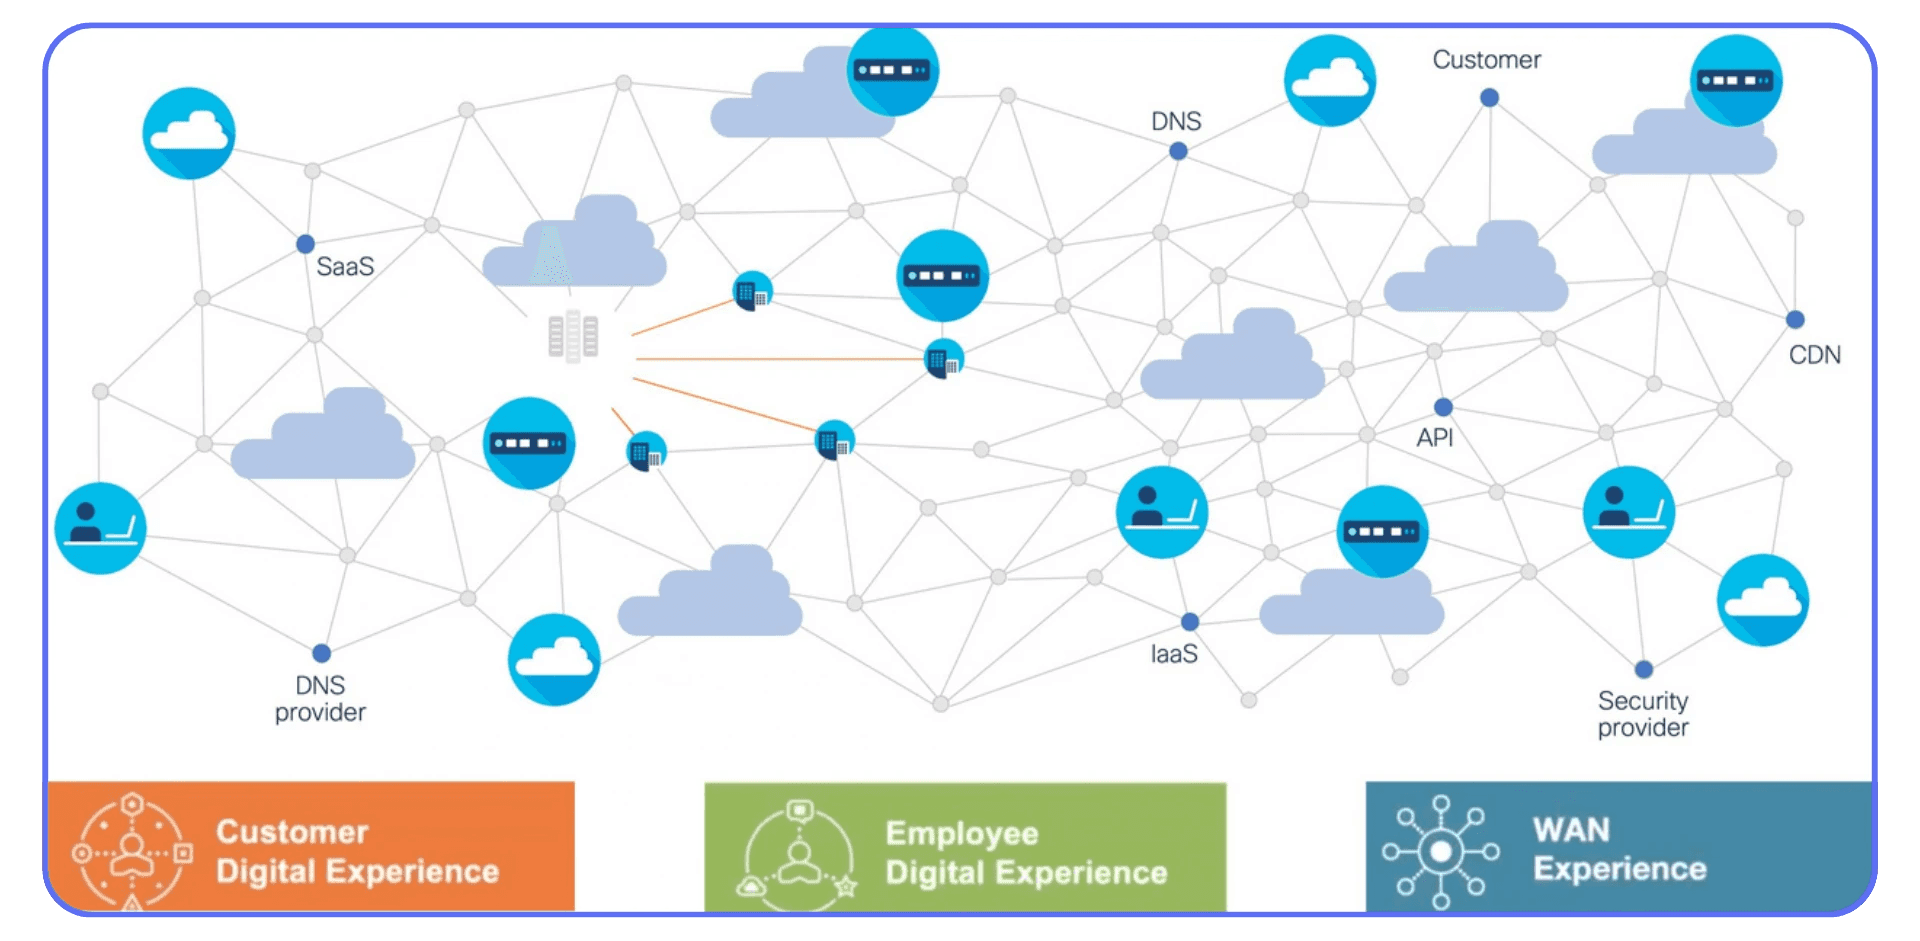
Monitor End-to-End, Not Just the Data Center
The weakest link is often outside your firewall, home Wi-Fi, LTE, hotel networks.
Solutions like ControlUp Edge DX, Nexthink, or ThousandEyes extend monitoring to the endpoint, giving you visibility into real user conditions.
When a user in Berlin complains about lag, you can tell whether it’s your broker in Frankfurt or their ISP in Kreuzberg. That context turns panic into problem-solving.
Don’t Forget Security Layers
Security tools can sabotage performance if mis-tuned. SSL inspection, VPN hair-pinning, and packet filtering add milliseconds each.
For remote access, use modern gateways with UDP passthrough and direct protocol acceleration. Avoid stacking multiple proxies just “for safety.” Secure doesn’t have to mean sluggish.
Stable network design isn’t glamorous, but it’s the invisible backbone of every smooth VDI experience. When latency drops and redundancy holds, users stop noticing the infrastructure, which is exactly what you want.
Strategy 6: Backup, Disaster Recovery & Failover Planning
When things really go wrong, and they will, backups and disaster recovery (DR) are what decide whether you’re offline for five minutes or five hours.
I’ve seen environments that looked flawless on paper crumble under a simple host failure because replication hadn’t run in weeks. DR isn’t about if you need it. It’s about when you’ll test it.
Start with RTO and RPO — and Mean Them
Two acronyms define your recovery posture:
RTO (Recovery Time Objective): How long you can afford to be down.
RPO (Recovery Point Objective): How much data you can afford to lose.
They’re not decoration. They dictate architecture.
If your RTO is 15 minutes but your backup system takes 30 to restore, that’s fantasy, not planning.
Regular Backups Aren’t Enough
Traditional VM snapshots or nightly backups aren’t a DR strategy. They’re a starting point.
For production-grade VDI or VM environments, you need layered protection:
Incremental and full image backups (e.g., Veeam, Altaro, Commvault)
Configuration and broker database backups, Horizon or Citrix Controllers, license servers, and FSLogix profiles
Off-site or cross-region replication to a second data center or cloud zone
Retention rotation (daily, weekly, monthly) for rollback and ransomware isolation
A backup you can’t restore in under an hour isn’t a backup, it’s a liability.
Replication: Synchronous vs. Asynchronous
Replication isn’t one-size-fits-all.
Synchronous replication mirrors data in real time, zero data loss, but higher latency and cost.
Asynchronous replication adds a delay but is more bandwidth-friendly and affordable.
For most Horizon or Citrix setups, asynchronous cross-site replication every few minutes hits the sweet spot between performance and safety.
For AVD, use Azure Site Recovery (ASR) to replicate session hosts and management VMs across paired regions.
Automate Failover — Don’t Rely on Panic
When disaster strikes, no one remembers manual procedures.
Automate failover using:
VMware SRM (Site Recovery Manager) for orchestrated recovery
Citrix Autoscale + Delivery Group Failover for cloud and hybrid pools
Azure Site Recovery Runbooks for one-click recovery or region failover
Test quarterly. Don’t assume it’ll “just work.”
Real DR readiness isn’t when everything’s backed up, it’s when you’ve actually restored it successfully under pressure.
Separate Backup from Production
Too many admins store backups on the same SAN or cloud subscription as their live environment. That’s not redundancy, that’s duplication.
Keep backups air-gapped or isolated via separate credentials, network zones, or even providers.
If ransomware hits your control plane, you don’t want it encrypting your last lifeline.
Document Everything
Every step of your recovery should be documented, versioned, and reviewed.
When you’re staring at a black screen and a ticking clock, “tribal knowledge” doesn’t help.
Write it down: which services start first, which credentials are needed, which scripts trigger failover.
The truth about DR is simple: if you haven’t tested it, you don’t have it.
When failure happens, not if, your preparation decides whether users lose minutes or days of productivity.
Strategy 7: Security & Hardening
Most admins think of downtime as a technical failure.
But in the last few years, the most painful outages haven’t come from hardware or software. They’ve come from security incidents.
When your control plane is compromised, downtime isn’t measured in minutes, it’s measured in headlines.
Downtime Starts with Access
The simplest attack path is often the most effective one: credential theft.
If a compromised account can reach your broker, management console, or storage backend, the rest is just automation.
Start with Zero Trust principles:
Require Multi-Factor Authentication (MFA) for all admin and user logins.
Segment management networks from user and application traffic.
Use just-in-time (JIT) admin access where possible (Citrix Cloud, Horizon Cloud, Azure Bastion).
I’ve seen one admin account without MFA bring down hundreds of desktops after a phishing attempt — not because the attacker was sophisticated, but because the perimeter assumed trust.
Harden Your Control Plane
The control layer (brokers, gateways, connection servers) is the brain of your environment. Protect it like one.
Use dedicated management networks, never expose Horizon, Citrix, or AVD management consoles directly to the Internet.
Patch immediately when vendors issue security advisories (especially for Citrix ADC or Horizon Connection Server).
Rotate service account credentials regularly, and avoid domain admin privileges for service bindings.
Disable unused ports and protocols, RDP open to the world is still one of the most common entry points for brute-force bots.
If it’s not in use, close it. Simple as that.
Patch Cadence Without Chaos
Security updates are tricky: skip them, you’re vulnerable; apply them blindly, you might break production.
The fix is structure:
Maintain a staging pool that mirrors production.
Test all patches (OS, agents, hypervisor, display protocols).
Track compatibility matrices, especially GPU driver and VDA versions.
Automate deployment using tools like Ivanti, Ansible, or SCCM, but gate every change behind validation snapshots. Consistency is the real security.
Protect User Profiles & Data
Attackers know users are the soft spot. FSLogix containers, redirected folders, and roaming profiles hold credentials, cookies, and tokens.
Keep these secured:
Encrypt profile shares (SMB signing, at-rest encryption).
Use separate credentials for storage access, never the user’s main login.
Monitor abnormal access patterns (e.g., profile disk mounted twice = red flag).
If ransomware gets into a profile share, replication will happily spread it across your entire cluster. Segmentation is survival.
Monitor, Detect, Respond
Prevention is half the job. The other half is visibility.
Integrate VDI logs into your SIEM (Splunk, Azure Sentinel, Elastic). Watch for:
Unusual logon patterns
Failed MFA attempts
Elevated privilege grants
Broker or VDA service modifications
Set up alerts that tie directly to actions, like disabling the compromised account or isolating an affected host.
People Are Part of Security
Even the best systems fail if the people running them aren’t aligned.
Run incident response drills. Teach admins how to recognize privilege escalation attempts.
Downtime caused by human error is bad. Downtime caused by human panic is worse.
In a world where downtime and breach often look the same, security is uptime.
The more you isolate, authenticate, and monitor, the less chaos you’ll face when someone, or something, inevitably tests your defenses.
What Doesn’t Work / Common Pitfalls
Every admin has their “never again” story, the one outage that looked small on paper but ended up breaking everything.
After years of helping rebuild environments post-failure, I’ve noticed the same patterns repeating. None of them are technical mysteries. They’re habits.
#1. “We’ll Just Throw More Hardware at It.”
If you’ve ever responded to performance issues by adding another host or upgrading storage tiers without understanding why the system was slow, you’re not alone.
It works for a week. Then it’s back.
Because the real cause usually isn’t capacity, it’s design.
You can’t hardware your way out of misconfigured profiles, image drift, or poor load balancing. Hardware hides problems. It doesn’t solve them.
#2. “If It Ain’t Broke, Don’t Touch It.”
That’s the fastest way to ensure it will break, when you’re least ready.
Static systems age badly. Certificates expire, patches pile up, firmware falls behind, and one day the login page just stops working because TLS versions moved on without you.
VDI environments live on constant change. The safest systems are the ones that evolve deliberately.
#3. Overengineering in the Name of “Resilience”
I’ve seen teams deploy dual SANs, triple brokers, and four-tier failover systems, and still go down because no one could remember which script ran first.
Complexity is the enemy of reliability. Every added layer introduces new dependencies and new ways to fail.
Aim for clear redundancy, not infinite redundancy. If your DR plan needs its own diagram to explain, it’s already fragile.
#4. Ignoring the Human Factor
We talk about uptime like it’s a technical metric. It’s not. It’s cultural.
Downtime often starts with one admin skipping documentation, one team assuming another handled the patch, one forgotten password stored in someone’s notes.
Resilient systems are built by teams who share context. If your only source of truth is tribal knowledge, your next outage is already scheduled.
#5. Untested “Disaster Recovery”
The phrase “we have backups” has caused more panic than comfort.
If you’ve never done a full failover test, you don’t have DR, you have hope.
Restoration isn’t the time to discover that your backup repository was encrypted with production credentials.
Schedule simulated failures quarterly. Pull a host offline, restore a snapshot, rebuild a broker. Confidence doesn’t come from documentation, it comes from repetition.
#6. Security Theater
Plenty of teams “lock down” their environment with 15 passwords, nested firewalls, and SSL inspection, then open RDP to the Internet for “temporary support access.”
That’s not security. That’s wishful thinking.
Real protection comes from isolation, MFA, and proper segmentation, not paperwork.
#7. Chasing Perfection Instead of Progress
I’ve seen admins spend months designing “zero downtime” architectures that never launch because the design phase never ends.
Here’s the truth: you’ll never eliminate every single point of failure. Focus on reducing blast radius, not reaching mythical perfection.
Downtime isn’t a single event, it’s a series of ignored warnings.
The good news? Every pitfall above can be fixed with process, visibility, and discipline.
And once you’ve covered those foundations, you’re ready for the final layer, turning your uptime lessons into shareable experience for your entire team.
Where Vagon Teams Fits
Even when you do everything right, redundant systems, flawless images, tuned networks, downtime still happens.
A service hangs. A session freezes. A user insists “it’s broken again” even though all your dashboards are green.
That’s where visibility becomes your last line of defense.
Not just infrastructure visibility, experience visibility.
Seeing What Users Actually See
Here’s the truth every VDI admin knows: metrics only tell half the story.
You can have perfect CPU graphs and zero alert noise while a designer’s workspace crawls because of a display driver glitch or profile container delay.
That’s why we built Vagon Teams to bridge that gap, not as another monitoring tool, but as a way to see what your users experience.
Instead of reading log files or replaying guesses, you can watch how sessions behave, how long apps take to launch, when lag appears, and where performance drops.
It’s like having a time machine for troubleshooting.
Turning Downtime Into Data
The hardest part of post-incident reviews is always the same: what exactly happened?
Vagon Teams helps teams document and share that, with real session data, replayable context, and performance metrics that go beyond “it was slow.”
That makes collaboration between IT, support, and engineering faster, and turns every incident into an opportunity to improve the system, not just patch it.
You don’t replace your existing tools. You augment them, adding a human layer of visibility on top of your VDI or VM stack.
It’s how admins move from reacting to understanding.
Sharing the Lessons That Keep Systems Up
Downtime prevention isn’t just architecture, it’s culture.
Vagon Teams gives you a way to capture experiences, annotate issues, and share them internally, so your whole organization learns from real events instead of repeating them.
When teams see the same data, not anecdotes, conversations change. Blame disappears, and uptime gets real.
Even the most resilient infrastructure can fail quietly.
But when you can see, share, and learn from every user experience, you stop chasing ghosts and start building confidence.
That’s what Vagon Teams is designed for, helping great systems stay that way.
Final Thoughts
Downtime changes the way you see systems. Before it happens, uptime feels like a number, a percentage to keep above 99%. But once it hits, you realize it’s never really about numbers. It’s about trust. The trust users have in the tools you manage. The trust your team has in the systems they’ve built. And the trust leadership has that everything will keep running, even when something breaks.
That’s the paradox of great infrastructure, when it works perfectly, nobody notices. You only hear about it when it fails. The truth is, preventing downtime isn’t a single project you complete and move on from. It’s a practice. A habit. It’s the mindset of designing for failure instead of pretending it won’t happen, of versioning every change, testing every failover, and documenting every fix.
Perfection isn’t the goal, resilience is. Resilient systems bend without breaking. They recover without panic. They teach you something every time they’re tested. The best teams I’ve seen share that same quiet discipline: they monitor everything, but don’t drown in alerts. They document relentlessly, but never stop improving. And when something fails, they treat downtime as feedback, not as failure.
If you can build that mindset into your virtual environments, uptime stops being a metric on a dashboard. It becomes a habit, a reflection of how your team works, not just how your systems perform. And that’s when the work you do behind the screens finally pays off, quietly, reliably, every single day.
Key Takeaway: The strongest VDI and VM infrastructures aren’t the ones that never fail. They’re the ones that learn faster than they break.
FAQs
1. What’s the most common cause of VDI downtime?
Usually, it’s not hardware. It’s configuration drift or a single overlooked dependency, like an expired certificate, overloaded broker, or storage misalignment. Most major outages start with something that looked “too small to matter.”
2. How often should I test failover or DR scenarios?
At least once every quarter. Once a year isn’t enough, too many dependencies change silently. Test failovers under real conditions: pull the plug on a broker, simulate a site outage, time your recovery.
3. How do I know if my network is the bottleneck?
Watch for user reports that mention “lag” or “delay” instead of “crash.” Use protocol analytics, Citrix HDX Insight, VMware Blast Analyzer, or Azure Network Watcher, to track latency, jitter, and packet loss. Anything over 150 ms round-trip will feel broken to end users.
4. What’s better for uptime, on-prem VDI or cloud-based VM solutions?
Neither is automatically “better.” On-prem gives you full control, but cloud platforms (like AVD or Horizon Cloud) often provide built-in redundancy and elasticity. The best setups are hybrid: local control for performance, cloud backup for resilience.
5. How can small teams implement redundancy affordably?
Focus on the control plane first. Two connection brokers, replicated databases, and off-site backups will give you more real-world uptime than a full multi-site cluster you can’t maintain. Redundancy doesn’t have to mean enterprise-level spend.
6. What’s the ideal patching frequency for VDI environments?
Monthly for OS and security updates, quarterly for platform components, always after staging validation. Use snapshots before applying any patch. Fast patching looks proactive, but untested patching creates its own downtime.
7. How do I monitor end-user experience effectively?
Combine infrastructure monitoring (CPU, IOPS, broker health) with session-level telemetry, logon time, frame latency, dropped frames. Tools like ControlUp, Citrix Director, or Vagon Teams can help you see what users actually experience instead of relying on averages.
8. Can downtime be eliminated entirely?
No, and chasing that illusion is how teams over-engineer themselves into chaos. The goal isn’t zero downtime; it’s predictable downtime. Build systems that fail gracefully, recover quickly, and teach you something every time they do.
9. How does Vagon Teams help in downtime prevention?
By showing what your dashboards can’t: real user experience. It captures performance data, logs, and session behaviors, so you can see exactly what users saw before an issue occurred. It turns downtime into a learning loop, fast, visual, and collaborative.
10. What’s one simple practice that reduces downtime across every platform?
Documentation. Write down everything, image versions, patch notes, network configs, and failover procedures. When things break, written knowledge restores faster than memory every time.
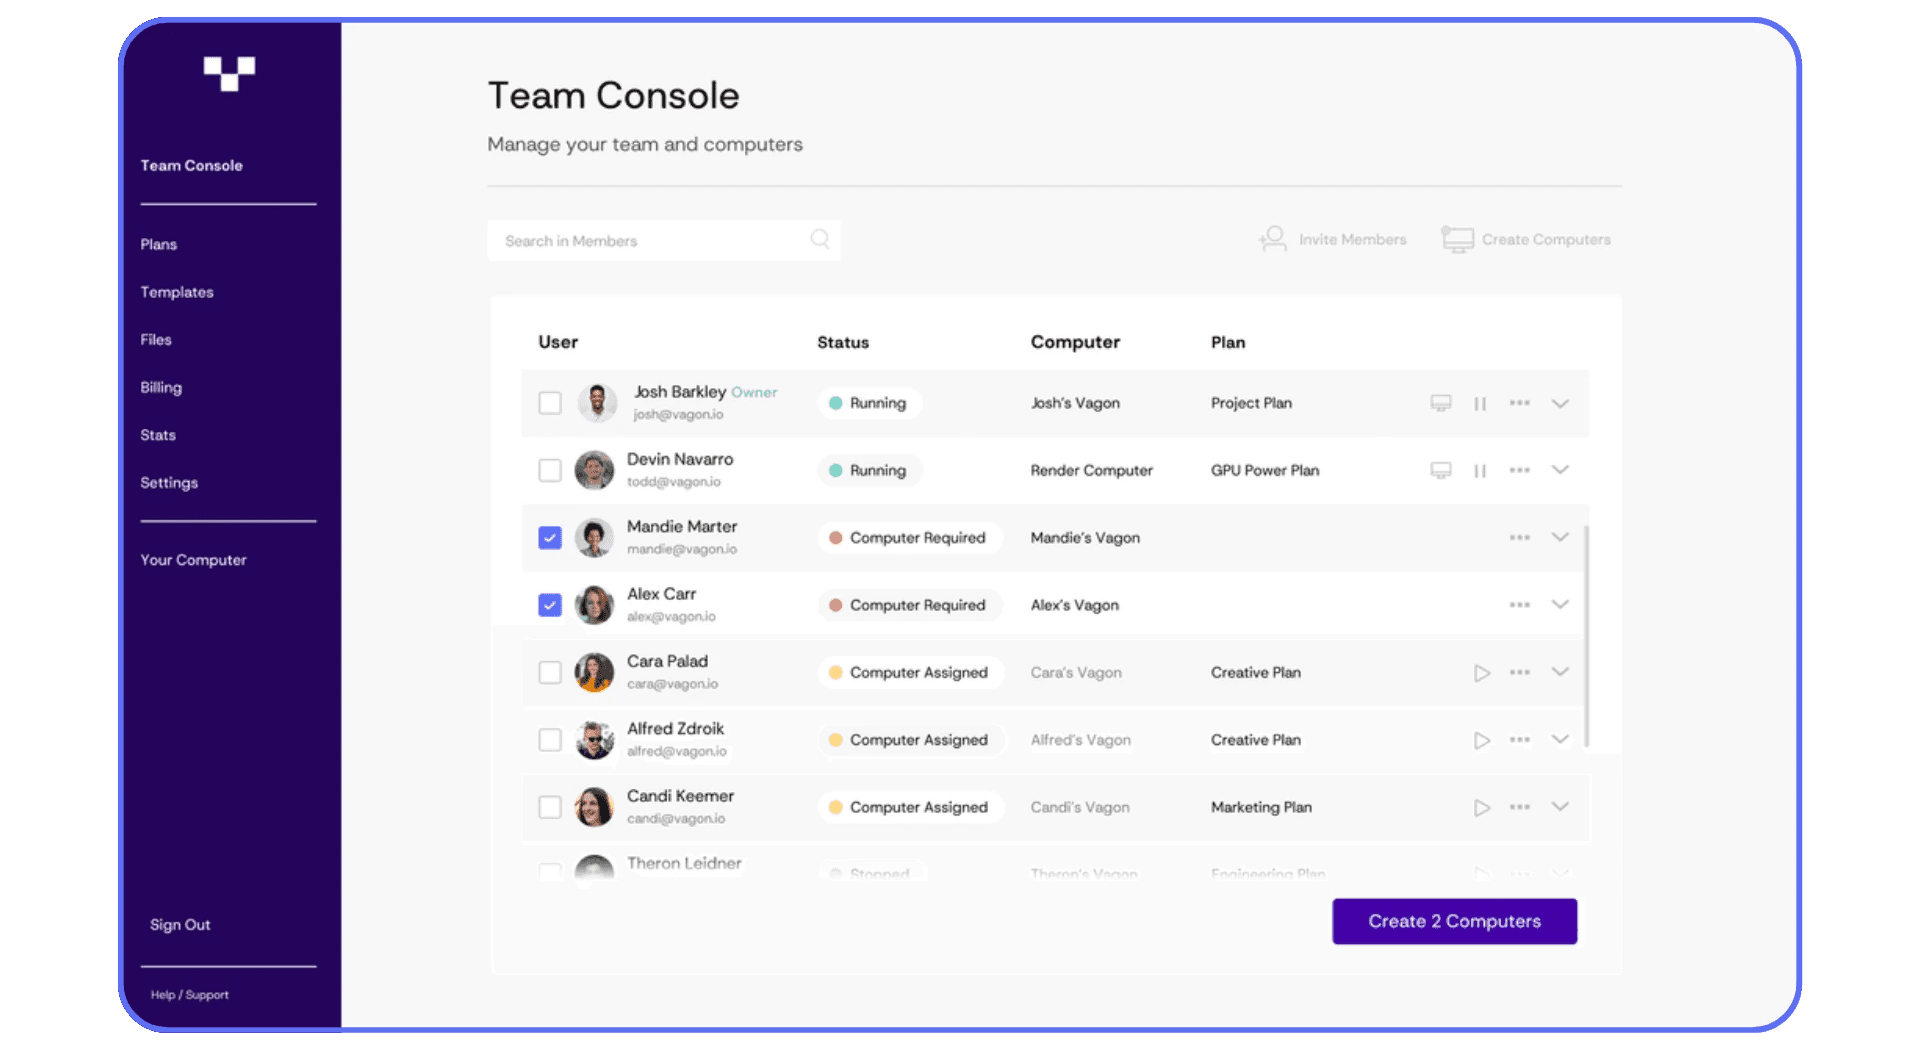
Scalable Remote Desktop for your Team
Create cloud computers for your Team, manage their access & permissions in real-time. Start in minutes & scale.

Trial includes 1 hour usage + 7 days of
storage for first 2 seats.
Scalable Remote Desktop for your Team
Create cloud computers for your Team, manage their access & permissions in real-time. Start in minutes & scale.
Trial includes 1 hour usage + 7 days of
storage for first 2 seats.
Summarize with AI

Ready to focus on your creativity?
Vagon gives you the ability to create & render projects, collaborate, and stream applications with the power of the best hardware.

Vagon Blog


Run heavy applications on any device with
your personal computer on the cloud.
San Francisco, California
Solutions
Vagon Teams
Vagon Streams
Use Cases
Resources
Vagon Blog
How to Run Inkscape on a Cloud Ubuntu Desktop (2026 Guide)
How to Run Krita on a Cloud Ubuntu Desktop for Digital Painting (2026 Guide)
How to Run GIMP on a Cloud Ubuntu Desktop (2026 Guide)
How to Run Jupyter on a Cloud GPU Linux Desktop (2026 Guide)
Vagon vs GitHub Codespaces: Cloud Dev Environments Compared (2026)
Vagon vs RunPod: Which Cloud GPU Is Right for You? (2026 Comparison)
How to Watch Your AI Agent Work on a Cloud Ubuntu Desktop (2026 Guide)
How to Run a Local LLM on Ubuntu in the Cloud (2026 Guide)
How to Run Blender on a Cloud GPU (Ubuntu): The Complete 2026 Guide
Vagon Blog
Run heavy applications on any device with
your personal computer on the cloud.
San Francisco, California
Solutions
Vagon Teams
Vagon Streams
Use Cases
Resources
Vagon Blog